Dear all,
I hope you’re doing well! ![]()
I need your assistance in resolving an issue. Specifically, I’d like to create a weekly chart to track cases that are on hold at the end of the week, specifically on the 5th day (Friday).
Here are the scenarios I’d like your help with:
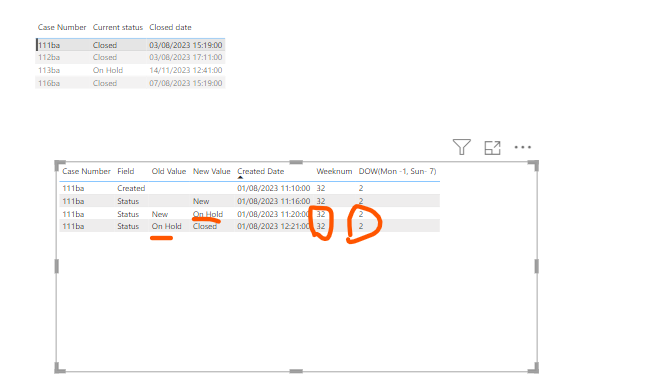
1st
In the first scenario, if the status is ‘On Hold’ on Tuesday but changes to a different status within the same week, it should not be included in the count.
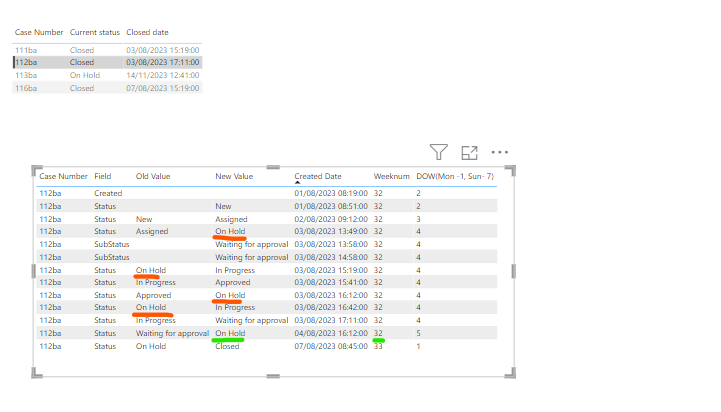
2nd scenario
In the second scenario, a case may have been on hold multiple times within the same week, but if its final status at the end of the week is ‘On Hold,’ it should be counted for that week.
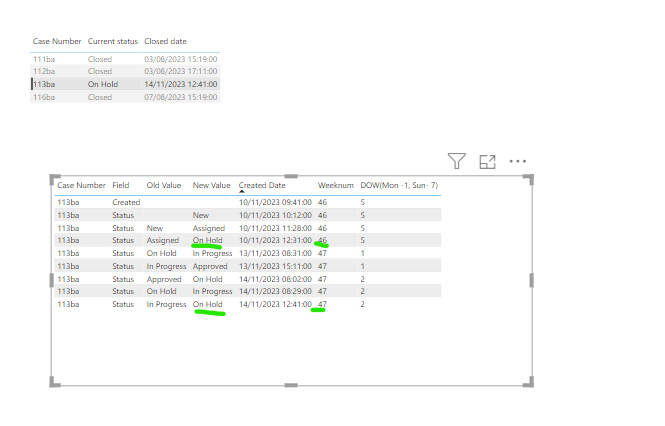
3rd scenario
In the third scenario, if a case has been on hold during the same week (week 46) and remains ‘On Hold’ in the subsequent week (week 47), it should be counted for both weeks (46 and 47).
Could you please help me here? ![]()
I have attached the file below
onhold weekly chart.pbix (118.6 KB)
I appreciate your assistance with this matter
Regards
Kate