Is there any way that I can show up waterfall using two measures?
I have one measure total sales and one more target sales. I want to show the movement of the sales compared to the target using a waterfall chart. Is there any way to do that?
Hi @Amirul,
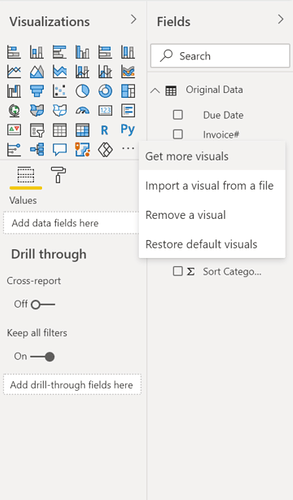
I believe that showing two measures is beyond the scope of the standard PowerBi Chart. However the xViz Waterfall Chart Custom Visual will take two measures. You can access it through the Get more Visual on the visuals pane.
Further, info on this via: https://www.youtube.com/watch?v=6M7AhO8vbNw
Cheers
Adam
1 Like
That one is helpful. Thanks Adam
