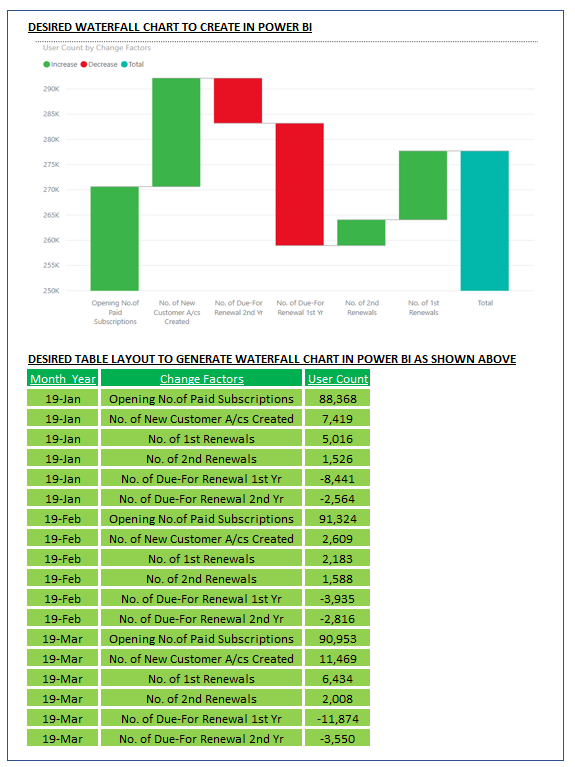
We have been using the Waterfall Chart in Excel to present the changes in User Count in the month along the lines of:-
of users at start of month
new users in the month
renewed users in the month
users due for renewal in the month
of users at end of the month
We want to be able to do the same in Power BI and noticed there is a similar Waterfall chart as well.
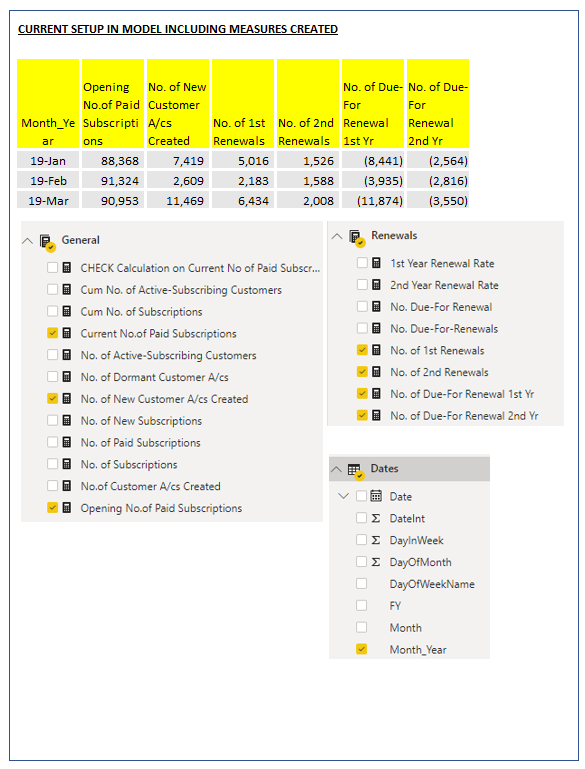
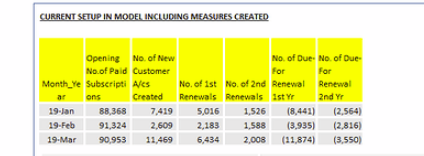
In our current Power BI model, line items #1 to #5 above are all Measures we’ve created in the model.
We understand that in order for Power BI Waterfall chart to work, the data table needs to be laid out as follows:-
Date / Factors / Value
where
“Date”" is the month of the year
“Factors” are the line items #1 to #5
“Value” is the respective corresponding value of #1 to #5
QUESTION
How do I create the waterfall chart table mentioned above in Power Bi?
Specifically, is it possible to create a measure (“Factors”) which is defined to be all the measures in #1 to #5 above?
How does this look in your data model in Power BI? If those 1-5 are basically your categories (X axis), then you can create a total value (y axis). Insert them both and it should be fine. However, I dont know how those 1-5 is laid out in your model.
Will probably need to see a demo model of the whole scenario to really offer solid assistance here.
You’re right in that you need to somehow create a physical table set up like you have exampled, but how that would actually works depends on quite a few things. For example how your data is setup initially.
Have you actually attempting to unpivot this particular table?
This could do it actually. It seems you might already have all the values in a table like this? Or is this a table you’ve just created in Power BI using the table feature?
You need a physical table to complete the unpivot.
This is about all I can help with right now. This would require a demo model to really help further.
Hi – thanks for looking into this…i did a bit of my own research looking for the answer and manage to find the solution based on the steps suggested by the link below…
Hopefully in future updates, Power BI will further enhance the customization of Waterfall Chart including the ability to change the “Total” label.
I did have issue with having the date component particularly on the “Opening number” of the waterfall chart…selecting more than one date period would result in the Opening number being summed up rendering the resultant waterfall chart incorrect…in the meanwhile I am just creating chart for one single period as a time.
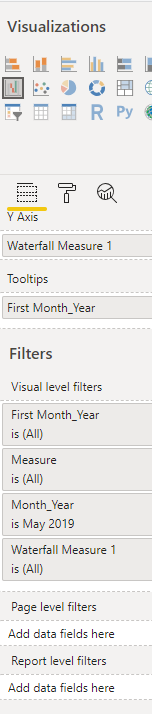
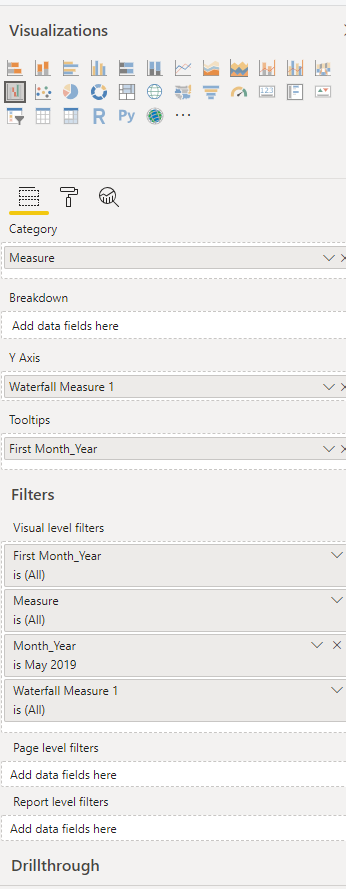
In the end my setup as follows:-
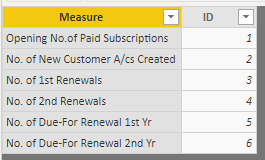
Created a disconnected table…
Created a measure using MAX
Waterfall Measure 2 =
MAX (Waterfall[ID])
Created another measure using SWITCH
Waterfall Measure 1 =
SWITCH(
[Waterfall Measure 2],
1, [Opening No.of Paid Subscriptions],
2, [No. of New Customer A/cs Created],
3, [No. of 1st Renewals],
4, [No. of 2nd Renewals],
5, [No. of Due-For Renewal 1st Yr],
6, [No. of Due-For Renewal 2nd Yr]
)
Potentially what you could do it create another column and bring in the year.
You would this need to make sure though that the measures (SWITCH measure) takes into account the year though so it’s filters the results in your table.