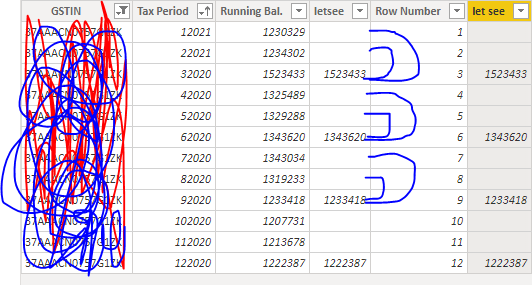
I want to compare value from above 2 value. For example

I want to populate row number 3 value to 2 and 1 so i can compare it with running bal
same row no 6 letsee valu to 5 and 4 row number .
.
how to do that pls help me in this.
Thanks,
Anurag
I want to compare value from above 2 value. For example

I want to populate row number 3 value to 2 and 1 so i can compare it with running bal
same row no 6 letsee valu to 5 and 4 row number .
.
how to do that pls help me in this.
Thanks,
Anurag
Hi,
I am not able to upload the above data .So i am uploading a demo excel.
The req is that i have to compare every 3 row with 1 and 2 and 6 with 5 and 4 and so on…
i hope i am clear Demo.xlsx (4.9 KB)
Hi @Anurag. Please use your sample data and create the desired outcome visual. Perhaps 1 possible way to get the previous row value is to add an index column then use that in your DAX. Please upload the resulting PBIX to help forum members visualize your issue and analyze possible solutions.
Greg
Hello Anurag,
Uploading a pbix file is always appreciated, I’m going to try helping you to my best understanding of your requirement.
First thing you shiould do is to “Fill up” in Power Query editor, this will populate the values in the way you want,;

As for comparing with the running bal i’m not sure you requested help with this as well, but here is a meassure that compares with running bal, returns “bigger”, “smaller”, “equal” according to the comparison result but you can use this comparison to a more personalised measure aswell
Comparison to Running Bal =

    If (  Max( table[letsee] ) = Max( table[Running Bal.] ) ,  "Equal",
    If (  Max( table[letsee] ) < Max( table[Running Bal.] ) ,  "Smaller",
    If (  Max( table[letsee] ) = Max( table[Running Bal.] ) ,  "Bigger",
    blank())))
You just need to use this in a table containing values from each row like row number or some sort of ID.
You can also have a calculated column to achieve anything else oyu want with the comparison
More About filling values in Power BI : Fill values in a column | Microsoft Docs
Thanks , for the reply but my problem is diffrent i have above provide demo excel like data and i need to compare every 3 ,6,9 and so on to above 2 value 1,2 in case of 3rd value and so on .
pls suggest i am able to get 3 value but hot to compare that 3rd value with 2nd and 1st value that the problem.
Hi @Anurag. Please upload a work-in-progress PBIX with your attempted solution along with a marked-up screenshot or Excel mockup of your desired outcome.
Greg
Hi @Anurag. As I thought, adding an index provided an answer. Using the index, check to see if it’s divisible by 3 with no remainder, and if so, use the value. For the remaining nulls, fill up.
Hi there,
I’m wondering what is the reason for that kind of analysis?
thanks
Keith
Hi,
Can we achive avbove req result with cal table or dax .
what is the reason for this analysis?
Hi ,
the 3rd value will be the closing balance and i want to check if the above value is in the range of 5% of that is yes then i have to show that product.
Hi @Anurag
Try below Calculated Column.
NewColumn =
VAR Sheet1name = Sheet1[Name ]
VAR Sheet1Period = Sheet1[period]
RETURN
IF (
MOD ( Sheet1Period, 3 ) = 0,
Sheet1[Value],
CALCULATE (
MAX ( Sheet1[Value] ),
FILTER (
sheet1,
Sheet1[period]
= ( QUOTIENT ( Sheet1Period, 3 ) + 1 ) * 3
&& Sheet1[Name ] = Sheet1name
)
)
)
Let me know if this doesn’t help or any other help is needed.
Thanks
Ankit J
Hi @Anurag, did the response provided by @ankit help you solve your query? If not, how far did you get and what kind of help you need further? If yes, kindly mark as solution the answer that solved your query. Thanks!
Hi @Anurag, due to inactivity, a response on this post has been tagged as “Solution”. If you have a follow question or concern related to this topic, please remove the Solution tag first by clicking the three dots beside Reply and then untick the check box.
We’ve recently launched the Enterprise DNA Forum User Experience Survey, please feel free to answer it and give your insights on how we can further improve the Support forum. Thanks!