Hi All,
what is the best way to visualize a virtual table like for example in a matrix?
For instance in this nice video https://www.youtube.com/watch?v=j_WNHWh3cUI what would be the manner to list the new customers? I just added the measure in a list of customer and those evalutating to 1 are listed. Is there a smarter way?
Hi @Roberto, we aim to consistently improve the topics being posted on the forum to help you in getting a strong solution faster. While waiting for a response, here are some tips so you can get the most out of the forum and other Enterprise DNA resources.
Use the forum search to discover if your query has been asked before by another member.
When posting a topic with formula make sure that it is correctly formatted to preformated text </>.
Use the proper category that best describes your topic
Provide as much context to a question as possible.
Include demo pbix file, images of the entire scenario you are dealing with, screenshot of the data model, details of how you want to visualize a result, and any other supporting links and details.
Like almost everything else in Power BI, there are multiple ways to do this. Here’s one approach I use frequently, built around the CONCATENATEX function:
List New Customers = //calculating which customers within any particular month have purchased but haven't done so for the last x number of days

VAR CustomerTM = VALUES( Sales[Customer ID] )
VAR PriorCustomers = CALCULATETABLE( VALUES( Sales[Customer ID] ),
                        FILTER( ALL( Dates ),
                            Dates[Date] > MIN( Dates[Date] ) - [Churn Time Frame Value] &&
                            Dates[Date] < MIN( Dates[Date] ) ) )

VAR Custlist =
CALCULATE(
    CONCATENATEX(
        EXCEPT( CustomerTM, PriorCustomers ),
        LOOKUPVALUE(
            Customers[Customer Name],
            Customers[Customer ID],
            Sales[Customer ID]
        ),
        ", ",
        [New Customer Sales],
        DESC
    )
)

RETURN
IF(
    HASONEVALUE( Dates[Date] ),
    Custlist,
    BLANK()
)
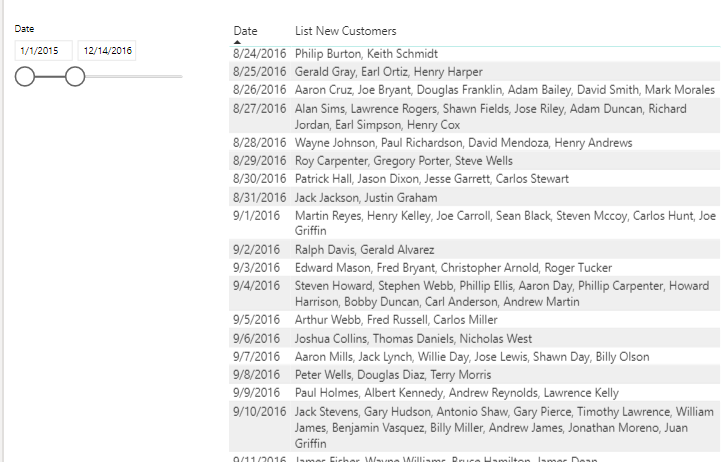
And here’s what the output looks like in table form with the new customers ordered by sales in descending order:
i created a table dropped the customer and total revenue in that table
then replaced the total revenue with the scalar value returned by the measure above
the result was that customers who were not lost, got blank values and were removed from the table and only the lost customer retained the sales value. this was very intuitive.
Good one. This is one of the things I find fascinating about Power BI and particularly about questions like this one. I strongly suspect if you ask half a dozen people how they do this, you will get six completely different answers - all of them completely valid.
In terms of @Roberto’s question of what is the “best” way to do this, I think it depends entirely on what you want to show in the visual and how you want it to appear.
That’s what I love of @sam.mckay Enterprise DNA. There is no better place where to find professionals in this awesome framework willing to help. I’ve started the journey some years ago, but still getting stuck and start to mumbling how to it, is still pretty frequent.
Thanks @BrianJ Thanks @C9411010
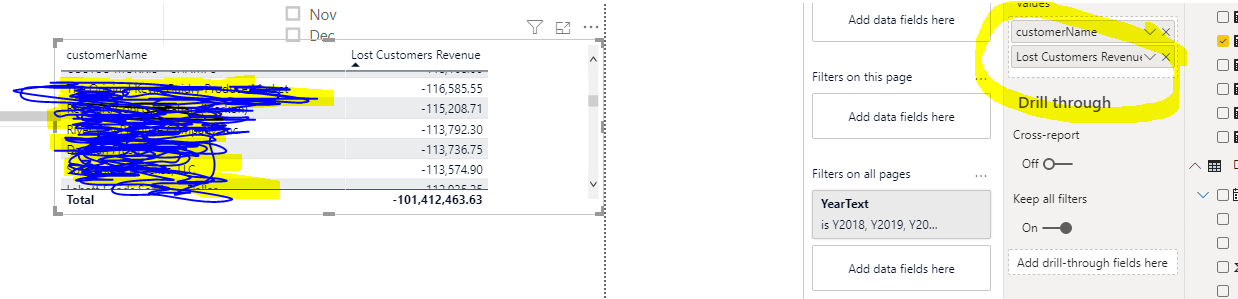
I have a little issue with virtualizing our lost customers and the lost revenues.
For our company only the yearly view is interesting, but I have no idea, how I need to adapt these formulas. I used the search function, but didn’t find a solution for my problem.
We need the lost customers (+ lost revenues) from 2017 to 2018, from 2018 to 2019 and from 2019 to 2020. If there’s an easy way to show the new cusomers as well, it would be great - but the lost ones are more important (as everytime ).
The data are attached (of course they are adapted).
Would you be so kind to create a new topic? New questions in solved threads are difficult to find so you can help members looking to assist by always creating a new one. Thank you!
Hello from another Greg, this one in Canada. I hope you’re staying safe and healthy.
I tried a quick idea to compare [Revenue TY] vs [Revenue LY] and came up with a possible solution for you.
if [Revenue TY] <= 0 and [Revenue LY] > 0, then set flag (this is a Lost Customer)
if [Revenue TY] > 0 and [Revenue LY] <= 0, then set flag (this is a New Customer)
then use the filter pane to only see the clients of interest.
(There were some also zero and negative sales in your sample dataset; not sure if these are representative or just noise, hence the “<=0” in the [No Revenue…] measures.)
I think I’ve missed something simple here, but perhaps this can help.
 ).
).