Visualization to Combine Pivoted and Non-pivoted Data

Hello,

pbix file is simplified and attached.

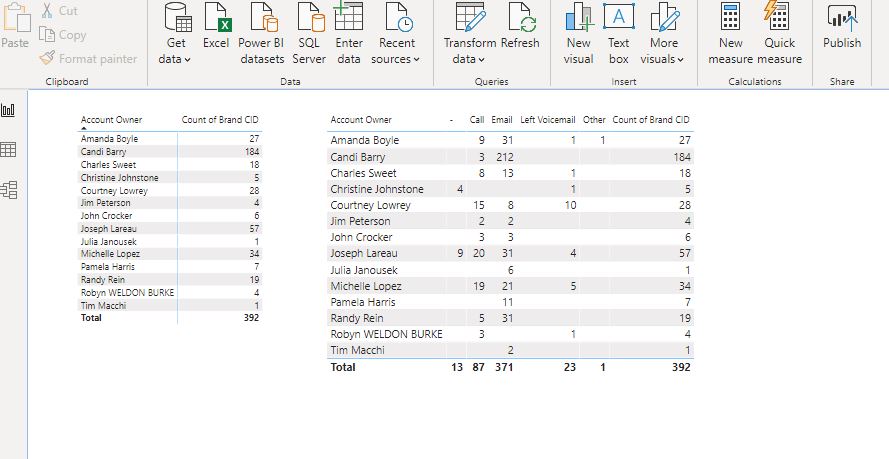
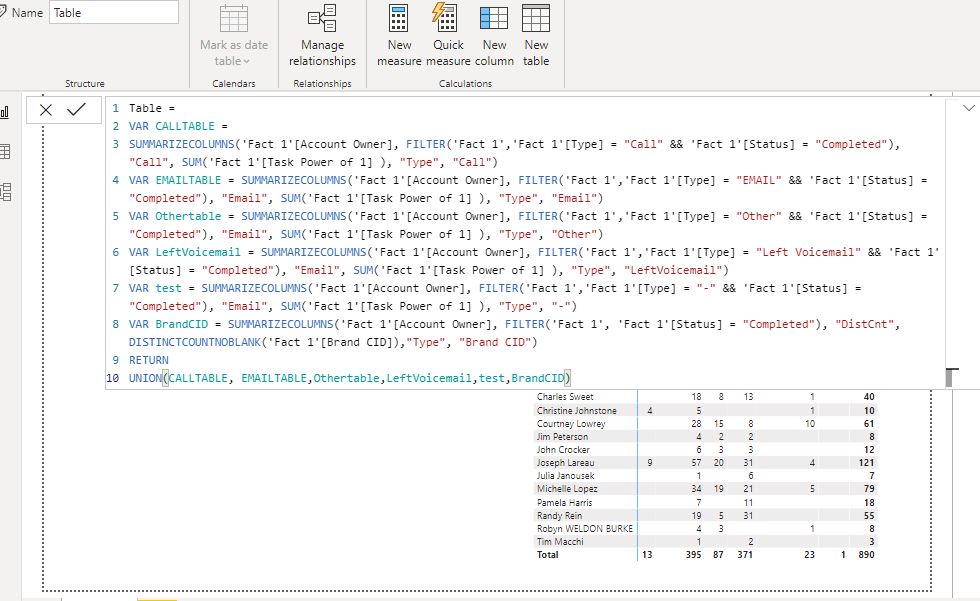
I have separate two “Matrix” visualizations… one which display a distinct count column and the other which is a pivot of ‘Type’ value counts. The goal is to find a way to present all of the columns in a single table/matrix visualization where “Account Owner” as the Rows entry.

I am unable to find an approach to do so. Any solutions or tips?

Thank you,
Kevin

Outbound Test.pbix (2.5 MB)

Hi @kkieger

PFA solution. Just pivot the Type column in power query.

Outbound Test.pbix (2.6 MB)

It’s an acceptable solution although I always prefer to solve in DAX.

Thank you very much.

@kkieger

In your case Power Query is the best approach.

If you want to do it in DAX… you’ve to create another summary table or you’ve to create multiple measures.

Outbound Test (1).pbix (2.5 MB)