Visualization - Custom chart asking for solution

Hello everybody, fighting with a chart and I’m hopping I can get some ideas from you.
Data set: 2 years (2019 and 2020) for 2 sets of data. 2019 has A, B, C and D as products. 2020 has the same but in June product A has been canceled.
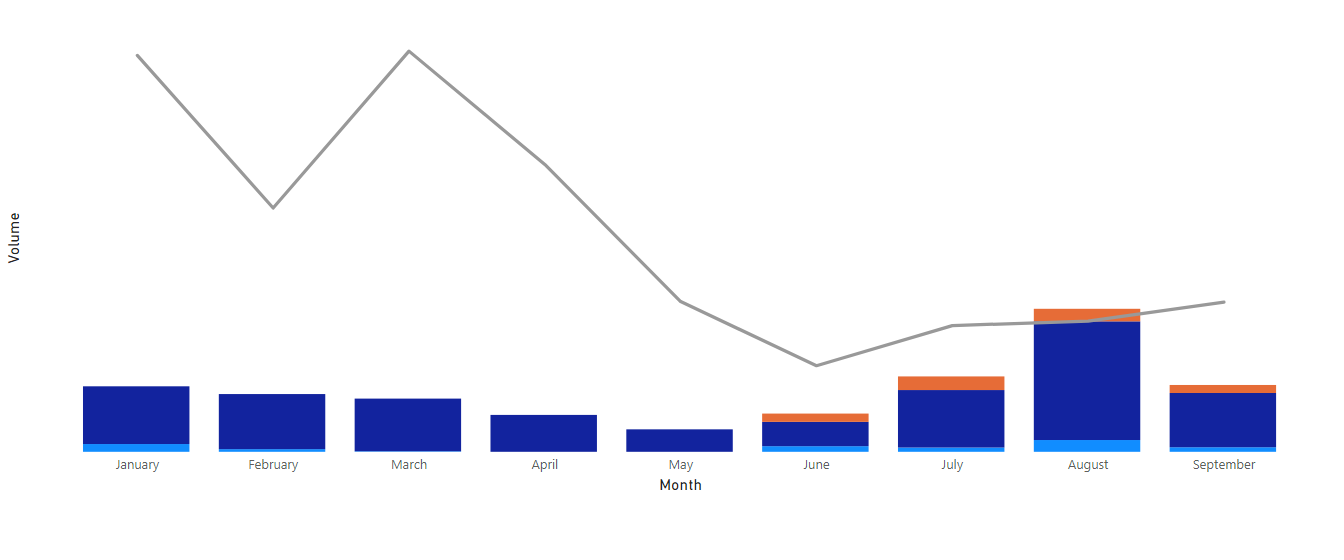
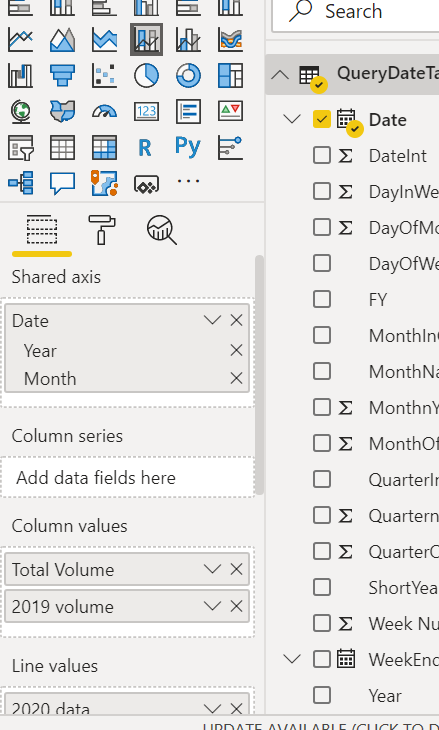
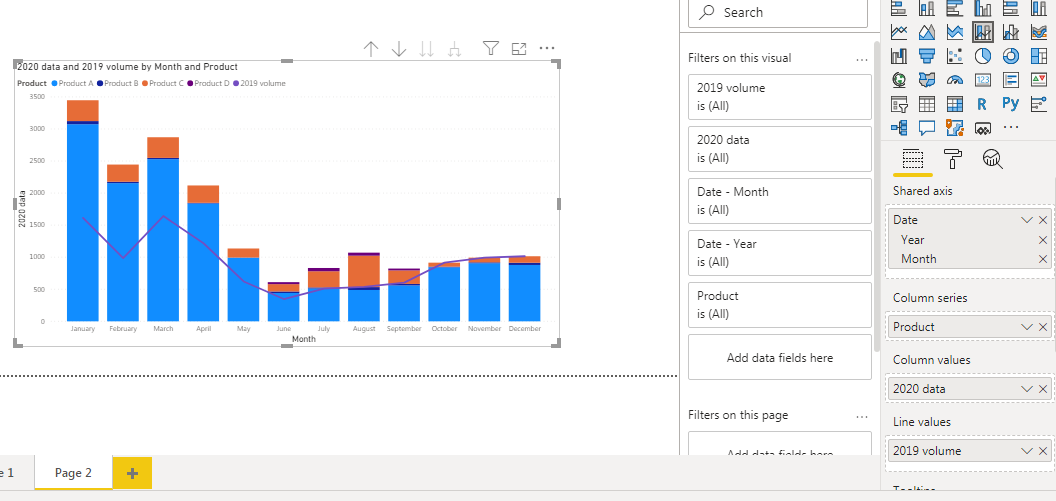
What I’m trying to show: 2019 monthly volume for product A and 2020 for B, C, D. need to Visualize B, C and D for the months of Jan to June (2020 compared with 2019) but more important I need to keep an eye as we move forward on what’s happening with the B, C, D in relation with last year product A. I have tried to use the Combo (columns and line) where the columns will be 2020 B,C,D and the line - last year product A. However, as the column chart is based on 2020 B, C, D I cannot have the the Oct to Dec displayed. I’m not stuck on the combo Chart…I just don’t see any other chart to serve my purpose.
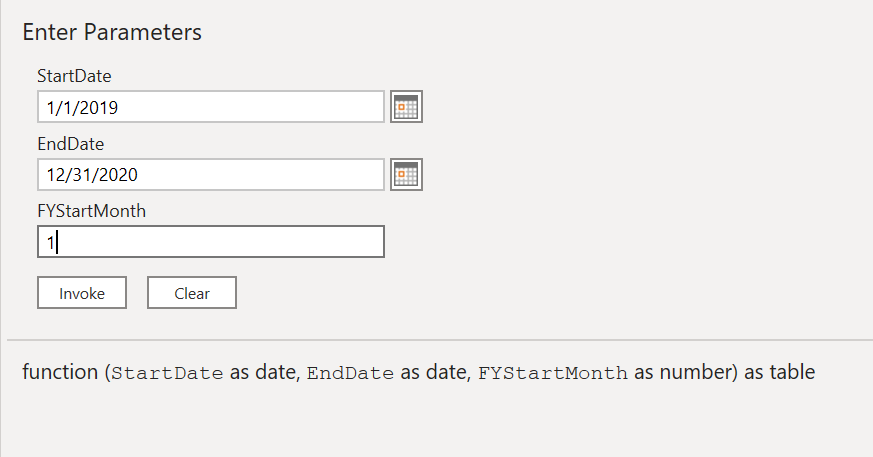
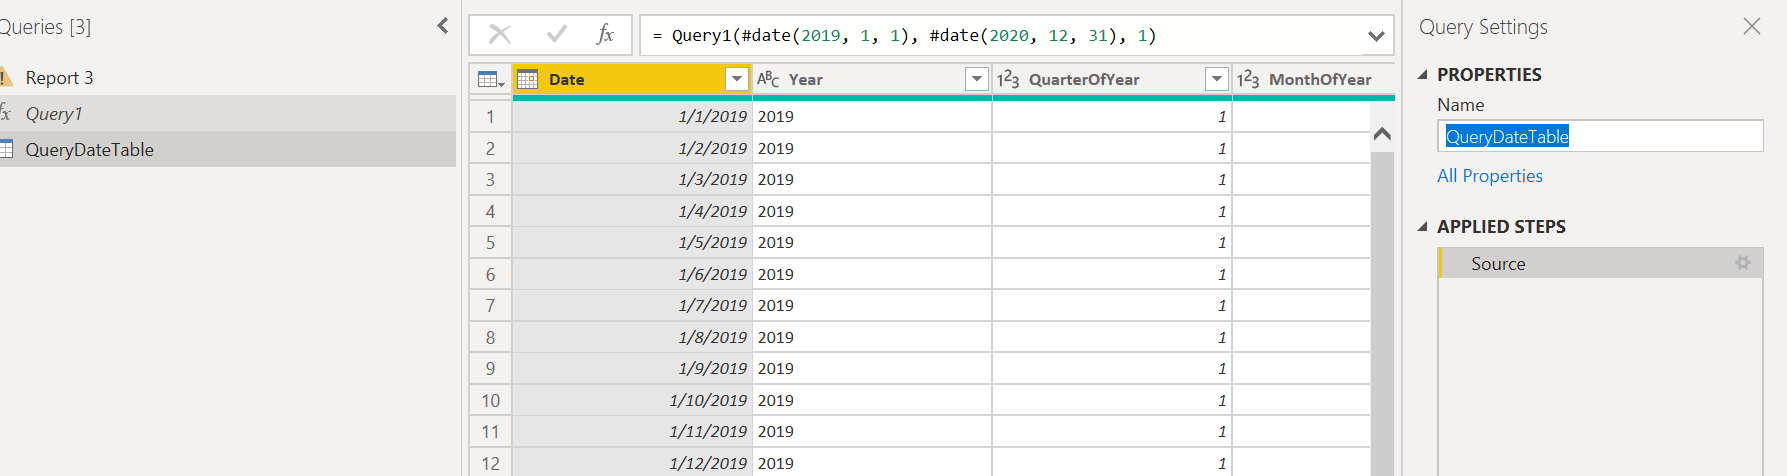
The data comes as one table. However, as I need to filter out product B, C and D from 2019 and and filter A from 2020 data set, I opted to go with 2 tables one for 2019 product A and one for 2020 product B, C, D linked based on a date table.
Attached is how it looks.

Question: Is there a way to include the months of Oct to Dec even if I don’t have 2020 data for them? the report is linked to a DW and refreshed daily.
or
Is there any other chart option that could help me achieve the concept?

Thank you very much for taking the time!
Anne

Hi @AnneCucuetu

Could you please share pbix file.

Hi and thank you! Just created a mock up with raw data. But this is pretty much what I have to work with.

Chart data.pbix (228.1 KB)

Hi @AnneCucuetu,

Are you looking for output like below.

If yes then you just need to add a Date table.

  1. You can goto Query Editor and add below date code.

     let fnDateTable = (StartDate as date, EndDate as date, FYStartMonth as number) as table =>
       let
         DayCount = Duration.Days(Duration.From(EndDate - StartDate)),
         Source = List.Dates(StartDate,DayCount,#duration(1,0,0,0)),
         TableFromList = Table.FromList(Source, Splitter.SplitByNothing()),   
         ChangedType = Table.TransformColumnTypes(TableFromList,{{"Column1", type date}}),
         RenamedColumns = Table.RenameColumns(ChangedType,{{"Column1", "Date"}}),
         InsertYear = Table.AddColumn(RenamedColumns, "Year", each Date.Year([Date]),type text),
         InsertYearNumber = Table.AddColumn(RenamedColumns, "YearNumber", each Date.Year([Date])),
         InsertQuarter = Table.AddColumn(InsertYear, "QuarterOfYear", each Date.QuarterOfYear([Date])),
         InsertMonth = Table.AddColumn(InsertQuarter, "MonthOfYear", each Date.Month([Date]), type text),
         InsertDay = Table.AddColumn(InsertMonth, "DayOfMonth", each Date.Day([Date])),
         InsertDayInt = Table.AddColumn(InsertDay, "DateInt", each [Year] * 10000 + [MonthOfYear] * 100 + [DayOfMonth]),
         InsertMonthName = Table.AddColumn(InsertDayInt, "MonthName", each Date.ToText([Date], "MMMM"), type text),
         InsertCalendarMonth = Table.AddColumn(InsertMonthName, "MonthInCalendar", each (try(Text.Range([MonthName],0,3)) otherwise [MonthName]) & " " & Number.ToText([Year])),
         InsertCalendarQtr = Table.AddColumn(InsertCalendarMonth, "QuarterInCalendar", each "Q" & Number.ToText([QuarterOfYear]) & " " & Number.ToText([Year])),
         InsertDayWeek = Table.AddColumn(InsertCalendarQtr, "DayInWeek", each Date.DayOfWeek([Date])),
         InsertDayName = Table.AddColumn(InsertDayWeek, "DayOfWeekName", each Date.ToText([Date], "dddd"), type text),
         InsertWeekEnding = Table.AddColumn(InsertDayName, "WeekEnding", each Date.EndOfWeek([Date]), type date),
         InsertWeekNumber= Table.AddColumn(InsertWeekEnding, "Week Number", each Date.WeekOfYear([Date])),
         InsertMonthnYear = Table.AddColumn(InsertWeekNumber,"MonthnYear", each [Year] * 10000 + [MonthOfYear] * 100),
         InsertQuarternYear = Table.AddColumn(InsertMonthnYear,"QuarternYear", each [Year] * 10000 + [QuarterOfYear] * 100),
         ChangedType1 = Table.TransformColumnTypes(InsertQuarternYear,{{"QuarternYear", Int64.Type},{"Week Number", Int64.Type},{"Year", type text},{"MonthnYear", Int64.Type}, {"DateInt", Int64.Type}, {"DayOfMonth", Int64.Type}, {"MonthOfYear", Int64.Type}, {"QuarterOfYear", Int64.Type}, {"MonthInCalendar", type text}, {"QuarterInCalendar", type text}, {"DayInWeek", Int64.Type}}),
         InsertShortYear = Table.AddColumn(ChangedType1, "ShortYear", each Text.End(Text.From([Year]), 2), type text),
         AddFY = Table.AddColumn(InsertShortYear, "FY", each "FY"&(if [MonthOfYear]>=FYStartMonth then Text.From(Number.From([ShortYear])+1) else [ShortYear]))
     in
         AddFY
     in
         fnDateTable 
    
  2. And then invoke the function as below.

  1. Name your table as “QueryDateTable” and then load it.

  1. Create a relationship

  1. Change your measure as below

    2019 volume = CALCULATE(COUNT(‘Report 3’[ID]),
    DATEADD(QueryDateTable[Date].[Date], -1, YEAR))

  2. Have below setting where Date in the x-axis is coming from your Date table.

2 Likes

Thank you very much for looking into this. However, my question is if there is a way to have the 2019 as line and 2020 as columns. As I don’t have data for Oct to Dec 2020 the chart is not displaying 2020 up to the end of year if I choose to have it as column. As I move forward into sep, oct, nov, dec how the columns (2020 data) are seen in relation with the line (2019 data oct to dec). Are they growing enough OCT to Dec 2020 and get closer to product A 2019 for same months last year (that no longer exist starting middle of June 2020)? Basically it should be a projection of 2019 data up to the end of the year where I’m overlaying what happens now in 2020. Hope that makes sense. Again, thank you very much for spending time on this one…

Hi @AnneCucuetu

Please check below if it meets your requirement. If yes then please use below DAX.

2020 data = 
VAR ProdA = IF (
        SELECTEDVALUE ( QueryDateTable[MonthnYear] ) > 20200700, 
        CALCULATE (
            [Total Volume],
            DATEADD ( QueryDateTable[Date].[Date], -1, YEAR )
            )
        )
RETURN
ProdA + [Total Volume]

Please see the attached file. The columns are Product B, C and D for 2020 data and the line is Product A 2019 data. Because of the chart type, the Months are based on the columns so…no data for Oct - Dec 2020. Not sure how you’ve got data in. It should’t be any as we are not there yet. Wondering if there is a way to trick the system to bring the months in.

Thanks for posting your question @AnneCucuetu. To receive a resolution in a timely manner please make sure that you provide all the necessary details on this thread.

Here is a potential list of additional information to include in this thread; demo pbix file, images of the entire scenario you are dealing with, screenshot of the data model, details of how you want to visualize a result, and any other supporting links and details.

Including all of the above will likely enable a quick solution to your question.

Thanks to the contributors of this post. Due to the length by which this post has been active, we are tagging it as Solved. For further questions related to this post, please make a new thread.