Hi, i have two filters which dictate the financial information on show in a matrix table, slicer 1 is a normal date slicer by Year & Month and slicer 2 is pre-set for 1M, 3M, 12M etc. so for example if i set slicer 1 to April-21 and then slicer 2 to 3M then the matrix will show financial information for the last 3 months Feb-21 to Apr-21 and this works good.
However, i now want to show part of the finance info in a bar chart, so for example if put Month & Year from the data table onto the Axis and then the finance measure onto the values the visual should show values for Feb-21 to Apr-21 but it doesn’t the visual only shows values for Apr-21 and i understand why because i have a slicer set to Apr-21. I tried turning off the interaction between slicer 1 and the visual and instead of just Apr-21 values i get values for all periods in my date calendar which is no good.
I then tried setting up a secondary date table which sat above my original date table and used the Month & Year from this table on my visual axis but this doesn’t work either. I’m obviously doing something wrong, can anyone point me in the right direction please?
@BCS You are already on the right track with a disconnected date table and Month & Year column, now you just need to build a bit more complex logic using DAX.
Measure 3 =
VAR N = 4
VAR CYMN = -- Value selected in the slicer
    SELECTEDVALUE ( 'Disconnected Date'[Calendar Year Month Number] )
VAR LastMonths =
    CALCULATETABLE (
        TOPN (
            N,
            VALUES ( 'Disconnected Date'[Calendar Year Month Number] ),
            'Disconnected Date'[Calendar Year Month Number], DESC
        ),
        'Disconnected Date'[Calendar Year Month Number] <= CYMN,
        REMOVEFILTERS ( 'Disconnected Date' )
    )
VAR MoveFilterToDates =
    TREATAS ( LastMonths, Dates[Calendar Year Month Number] )
VAR Result =
    CALCULATE ( [Total Sales], KEEPFILTERS ( MoveFilterToDates ) )
RETURN
    Result
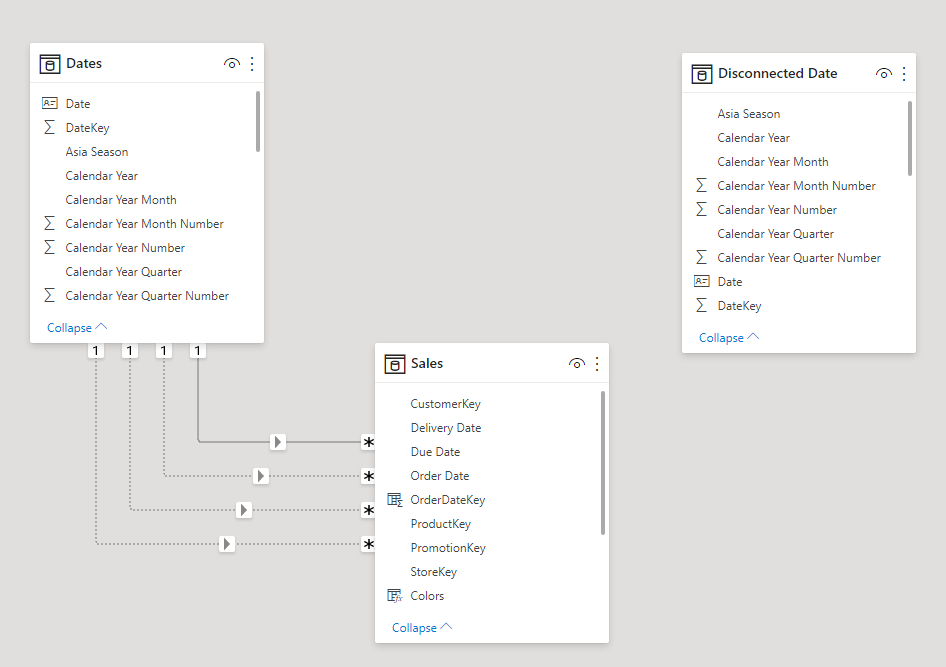
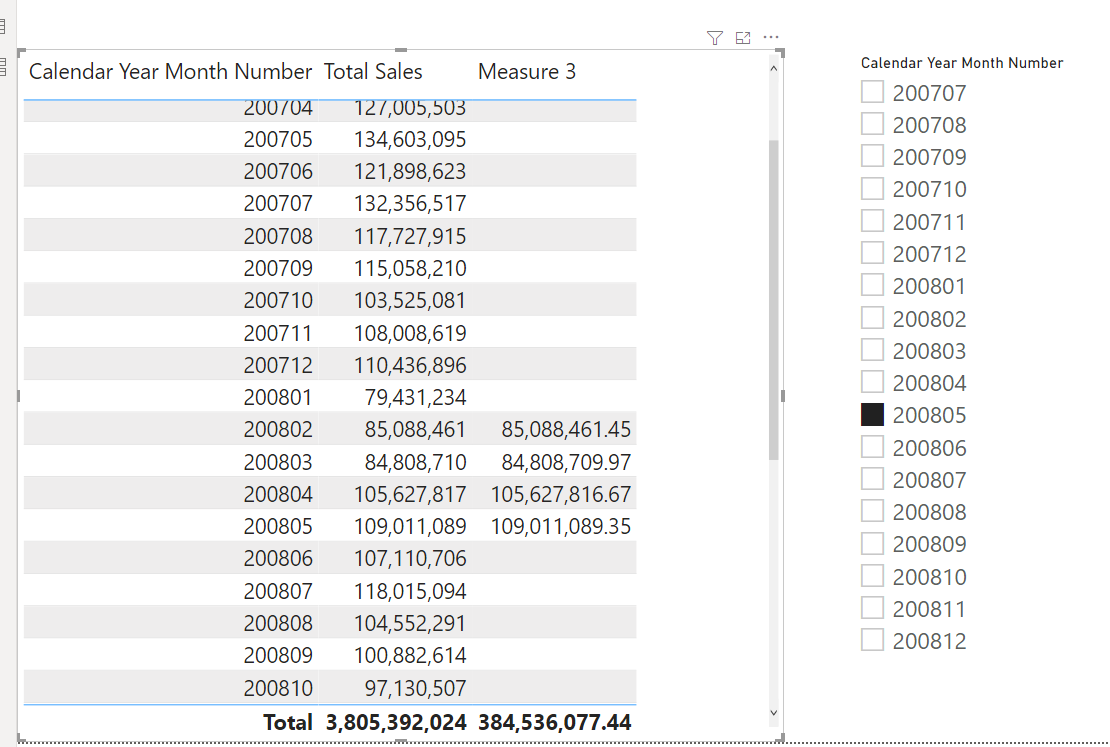
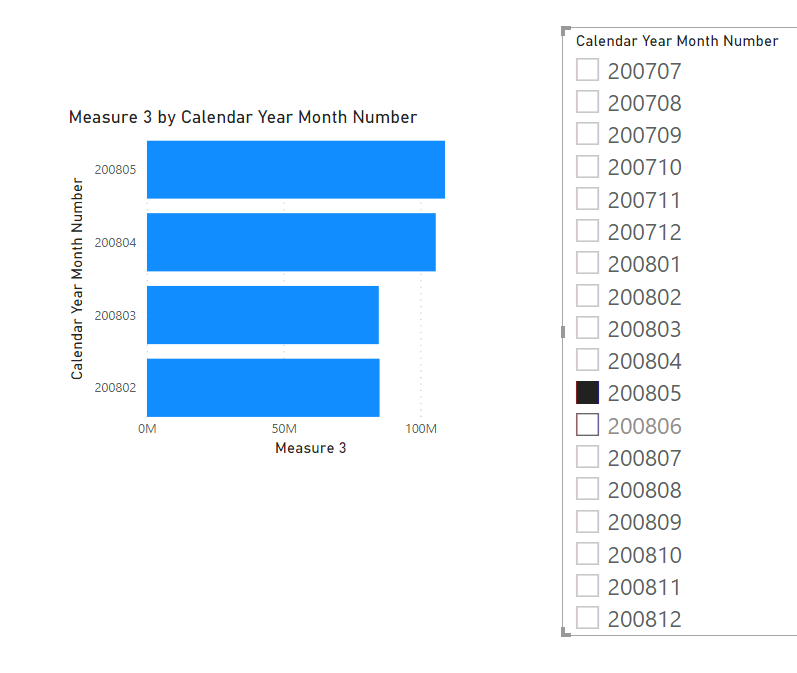
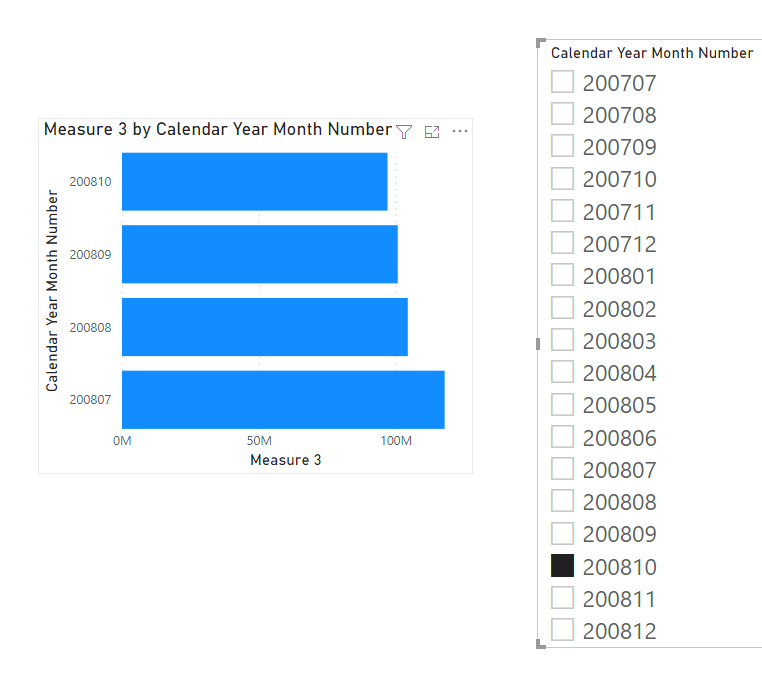
In the below image the slicer is from disconected date table and the column in the matrix is from the connected dates table.
One difference that i can see in your set-up as to mine is that the Month & Year selection is from your disconnected date table whereas with my set-up the Month & Year selection is from my normal date table and the reason for this is that the users wanted a settings tab so they only had to select the month end date, budget etc. once and this would filter all the visuals on the whole report instead of having to select the month on each tab of the report and that works for everything until now where i want one visual to show something a bit different.
I tried putting the disconnected date table month & Year column on the visual axis and write a dax measure but it didn’t work. Do you know if it is even possible to do it this way as opposed to your way where the disconnected date is the selected date rather than the axis date?