Hi,
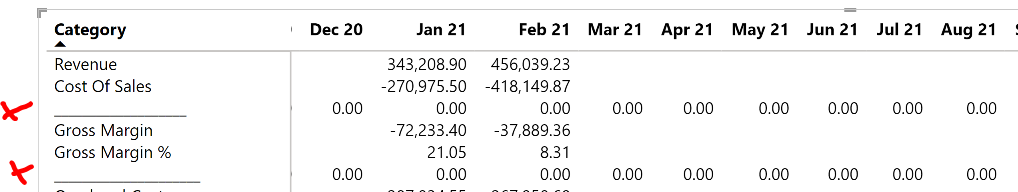
I have a second date table so that i can see values for a range outwith my normal date slicers. The problem is that when i use the Month & Year column from my new date table in my visual i get months which have no values.
I watched the “Dynamically Subsetting Table Visuals” that @BrianJ did but i am struggling to take this from an individual day date range and translate this to a month & year date range.
Below is my measure that i drop into my visual as a filter but it doesn’t work presumably as the >= and <= don’t work with months??
Selected Date Range =
Var Cond =
IF(
SELECTEDVALUE(Dates2[Month & Year]) >= ‘Key Measures’[Selected Min Date Month & Year] &&
SELECTEDVALUE(Dates2[Month & Year]) <= ‘Key Measures’[Selected Max Date Month & Year],
1,0)
Return
Cond
Try using Monthnyear, rather than Month & Year. The former is the numeric sort field for the latter, so >= and <= will work properly with those, as opposed to Month & Year, which is text.
And to make sure I understand Dates2 is a disconnected table, correct?
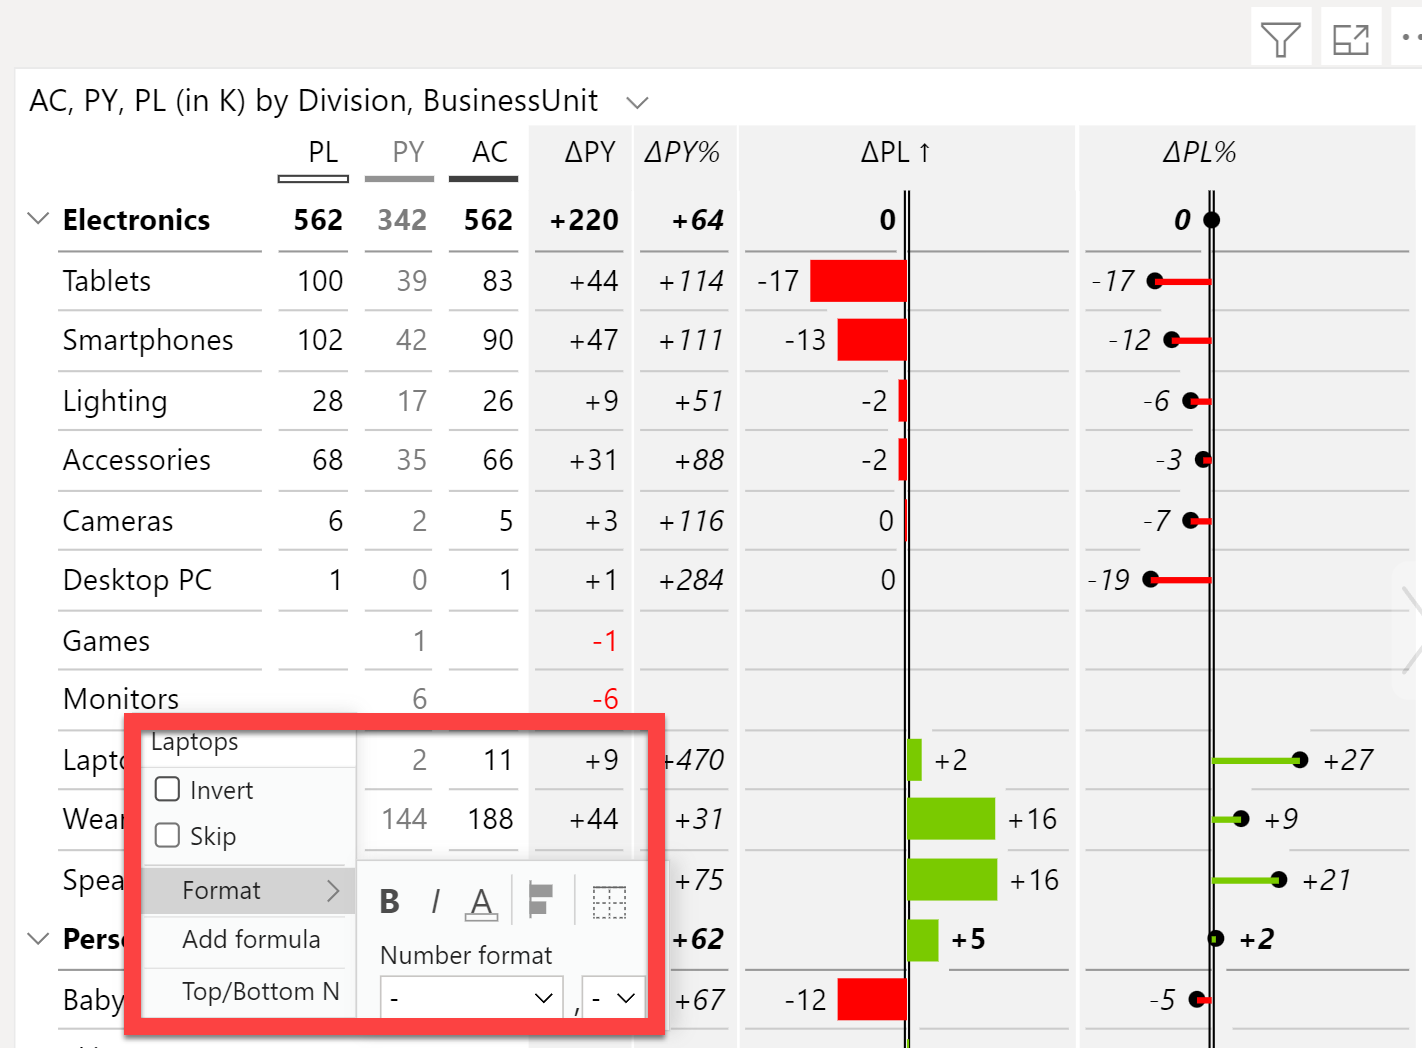
Hmmm…that’s an interesting question. The simplest answer is to use a better matrix visual that allows for more powerful formatting options. For example, Zebra BI Tables has a right click Excel-type format menu that allows you to set those types of seperators as attributes on a real data row, not as the kludgy row insert that the native matrix makes you do.
If you want to stick with the native matrix viz, there may be a way to do this by turning the IF statement into a SWITCH(TRUE()) statement, with the first condition of the SWITCH being that if it’s a spacer row to just return a blank. However, to move forward with that, I’ll need your PBIX file to play with since I’m pretty sure that will work, but don’t want to say for certain until i test it.
Great - glad to hear that worked for you! As a service to others who may have a similar question in the future, can you please post your final measure in this thread?