Based on the model posted on the link https://forum.enterprisedna.co/t/deneb-template-toggle-button/31760. How do I change the color of the bars and the Deneb blue bars visual captions and labels in the posted file?
Deneb - Toggle Button.pbix (1.7 MB)
barchart.json (3.4 KB)
Can you Help me @Greg ?
Hi @FabianaSantos. As always, please upload your work-in-progress PBIX file to help the forum member review your issue. Marked-up screenshots of what you’re looking for would help as well, as I don’t see any “blue bars” in this sample.
Here’s the standard forum request for more information:
To help us further analyze your current state and visualize your issue, could you please provide as many as you can of:
- Your work-in-progress PBIX file, using sanitized data if necessary
- here’s @BrianJ’s YouTube video on how to anonymize data in a Power BI file: https://www.youtube.com/watch?v=VmWD7Ayw_NI
- Your dataset as an Excel file (again, sanitized if necessary)
- A detailed mock-up (marked-up screenshot(s) of the visual(s) in question or Excel file(s)) showing your desired outcome.
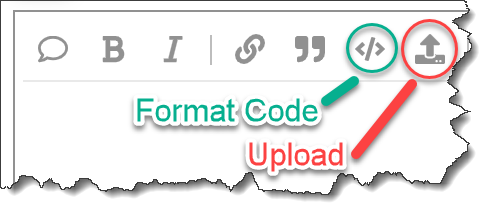
Also, if you provide DAX, Power Query, or Deneb JSON code in your post, please format it using the built-in formatter.
Finally, calling-out a specific forum member is discouraged, as it often far reduces the number of members who will review your post.
Greg
OK … I looked further … I was confused by your first link. After downloading your PBIX file, I’m guessing that you’re referring to the native Power BI bar chart: the colour of the bars has nothing to do with Deneb and can be set normally using a standard DAX measure.
Greg
OK x 2 … now I understand … you’ve replaced the native Power BI bar chart with a Deneb bar chart, so can simply add a color key:value pair.

Hope this helps.
Greg
eDNA Forum - Deneb Bar Chart Colour.pbix (1.7 MB)
I thought the question was aimed at harvesting the selected value based on one deneb visual (i.e., the light vs dark switch) and linking that to a color in another deneb visual (the bar chart) perhaps by adding additional measures to the bar chart visual that are conditioned by the light vs dark visual.
Something like dragging your
Text Colour =
IF( [Toggle Opposite] = "Dark", "#FFFFFF", "#000000" )
into the deneb bar chart visual, and rather than hard coding "color":"red" you would instead use something along the lines of "datum[Text Color]".
Then the deneb bar chart visual could be controlled even more finely than the fx conditions you have on the pb native visuals.
That doesnt work. It seems that axis properties are not directly controllable via field references or measures.
Instead of adding a measure like [Text Color] into the deneb visual, I tried including the [Toggle Opposite] measure and adding conditional logic to determine labelColor by testing if [Toggle Opposite] == "Dark":
"encoding": {
  "x": {
    "field": "Sales CY__highlight",
    "axis": {
      "labelColor": {
        "condition": {
          "test": "datum['Toggle Opposite'] === 'Dark'",
          "value": "#8DB41D"
        },
        "value": "#FA0019"
      }
    }
  }
}
That also didn’t work. The labelColor is always the “else” color.
Hi @FabianaSantos.
I concur with @HufferD, the correct syntax for label colours seems to be elusive in Vega-Lite. Using a transform I was, however, able to calculate (and use) the bar colour, so it now responds to the toggle button:
Here’s the code:
{
  "data": {"name": "dataset"},
  "transform": [
    {
      "calculate": "datum['Toggle Opposite'] == 'Light' ? 'blue' : 'green'",
      "as": "_bar_colour"
    }
  ],
  "encoding": {
    "y": {
      "field": "Month & Year",
      "type": "nominal",
      "sort": {
        "op": "sum",
        "field": "MonthnYear",
        "order": "ascending"
      }
    },
    "x": {
      "type": "quantitative",
      "axis": {"title": "Sales CY"}
    }
  },
  "layer": [
    {
      "name": "NON_SELECTED",
      "mark": {
        "type": "bar",
        "color": {
          "expr": "datum['_bar_colour']"
        },
        "opacity": 0.3,
        "tooltip": true
      },
      "encoding": {
        "x": {"field": "Sales CY"}
      }
    },
    {
      "name": "SELECTED",
      "mark": {
        "type": "bar",
        "color": {
          "expr": "datum['_bar_colour']"
        },
        "tooltip": true
      },
      "encoding": {
        "x": {
          "field": "Sales CY__highlight"
        },
        "opacity": {
          "condition": {
            "test": {
              "field": "__selected__",
              "equal": "off"
            },
            "value": 0
          },
          "value": 1
        }
      }
    }
  ]
}
Hope it helps.
Greg
eDNA Forum - Deneb Bar Chart Colour - V2.pbix (1.7 MB)
1 Like
Thank you very much!