Dear DNA team,
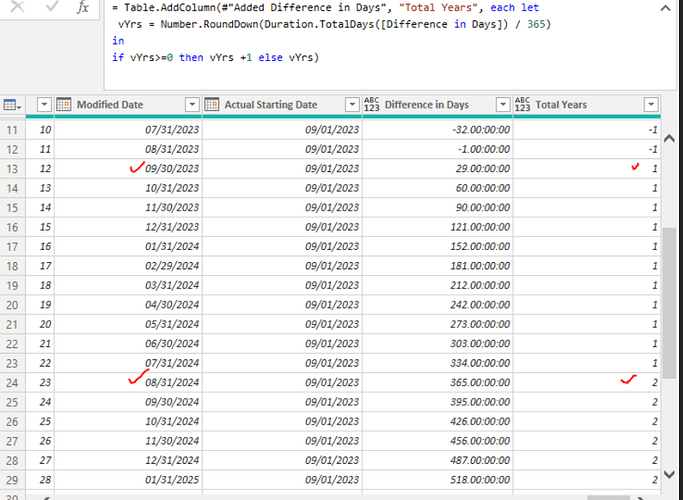
May I ask one question is there any way we can dynamically calculate the year variance between dates in the power query?
I prefer to write it in power query rather than writing DAX due to the business requirement. Your kind support will be appreciated.
In the picture, I was tried to divide by 365 but that is not giving me the accurate/correct answer for the special case such as “Leap year”. As you can seen in row 24, the answer supposed to be 1 as 2014 is leap year.
Hence, please help.
Thanks
Myat
Hi @anonymous124,
See how this works for you. Just copy the entire script into a new blank query.
let
    Source = Table.FromRows(
        {
            {#date(2023, 7, 31), #date(2023, 9, 1)},
            {#date(2023, 9, 30), #date(2023, 9, 1)},
            {#date(2024, 8, 31), #date(2023, 9, 1)},
            {#date(2024, 9, 30), #date(2023, 9, 1)}
        }, type table [Modified Date = date, Actual Starting Date = date]
    ),
    fxYearVariance = (Date1 as date, Date2 as date) =>
        [
            Order = List.Sort( {Date.From(Date1), Date.From(Date2)} ),
            Sign = if Date1 < Date2 then -1 else 1,
            LeapDays = List.Count( List.Select(
                List.Dates( List.First(Order), Number.From( List.Last(Order) - List.First(Order) )+1, Duration.From(1)),
                each (Date.Month(_)=2 and Date.Day(_)=29) )),
            Calc = Number.RoundDown( (Duration.Days( Date2 - Date1 ) + (LeapDays*Sign)) / 365 ),
            YearVariance = if Calc >=0 then Calc +1 else Calc
        ][YearVariance],
    t = Table.AddColumn( Source, "Test", each fxYearVariance( [Actual Starting Date], [Modified Date] ))
in
    t
It returns this result.

I hope this is helpful

