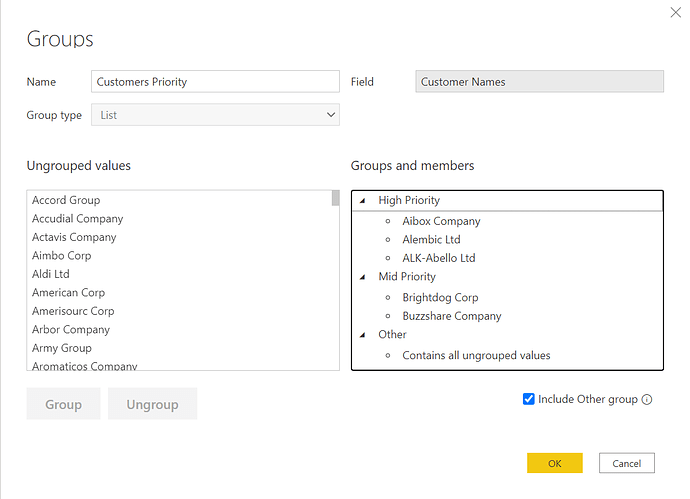
I am referring to using the “New Group” function available as an option on columns.
I am not clear on how to utilize such a Group as a filter within a DAX measure. The scenario is described in the attached. I’d prefer not to include the pbix file with this issue, since several of my questions are generic in nature.
In addition to the specific question in the attached, my more general questions are:
- What search string should I have used in looking for my answer to my “group” question, specific to use of the “New Group” option?
- Rather than the selection of column values available in the New Group feature, if the values could be identified via a Contains “Director” or “Executive” clause, is there a DAX approach to this filter rather than using ‘New Group’?
Best regards,
Kevin
EnterpriseDNA - Group and Filter Question.docx (180.0 KB)
@kkieger ,
Without a PBIX, I can’t provide a really specific answer, but in general terms I think this sort of construct will get you what you need. The CONTAINSSTRING function will allow you to do the sort of grouping you are attempting to do right within the filter conditions of you DAX expression, ala:
Senior Reporting Level =
CALCULATE (
    COUNTROWS ( Employees ),
    FILTER (
        ALL ( Employees ),
        CONTAINSSTRING (
            Employees[Job Title],
            "Director"
        )
    )
)
CONTAINSSTRING is also not case sensitive, so it will also automatically pick up “director” in the string. If you want it to be case sensitive, you can use CONTAINSSTRINGEXACT instead.
I hope this is helpful.
Thanks, Brian.
Your response makes sense in the context of a CONTAINSSTRING clause. However, I can’t just use a text string such as “Executive” since some job position values which contain “executive” should be excluded while others included. Thus, I used the “New Group” column option per the attached document to specifically associate select Job Positions to a Senior Reporting Level group.
My question in the attachment is how a CALCULATE - FILTER - COUNTROWS measure works with the “Group” column as its filter. If my table has three columns - ‘Employee ID’, ‘Job Position’, and the ‘Job Position - Senior Level’ group I created, then what is the DAX measure logic to count the employees with job positions in the Senior Level group?
I’m ultimately not finding examples of using the ‘New Group’ column function once establishing the groups.
Kevin
@kkieger ,
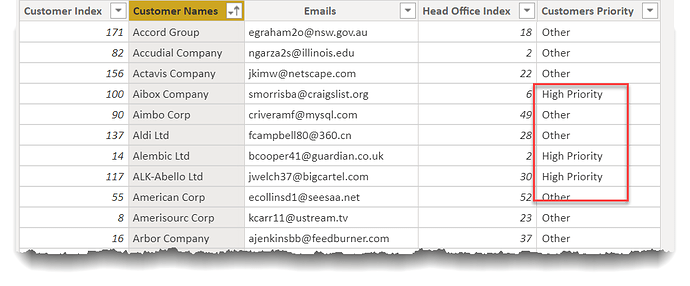
From a DAX perspective, the groups created functions like a calculated column. In a sense, you can just think of that grouping function as a graphical front end to a SWITCH or SWITCH(TRUE) construct.
I created a simple example using the EDNA Practice Dataset external tool.
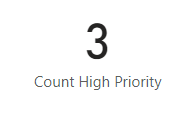
Count High Priority =
CALCULATE(
    COUNTROWS( Customers ),
    FILTER(
        ALL( Customers ),
        Customers[Customers Priority] = "High Priority"
    )
)

I hope this is helpful. Full solution file attached.
@kkieger ,
Just a brief follow-up to our previous discussion – yesterday, Patrick from GIAC posted a great video on how to create these type of groupings within Power Query, thus incorporating them as a physical column in the data model itself. Very cool technique, that I was not aware of.
– Brian
Hi @kkieger, did the response provided by @BrianJ help you solve your query? If not, how far did you get and what kind of help you need further? If yes, kindly mark as solution the answer that solved your query. Thanks!


