I got data that contains app_id, stage of the application process. An app_id can have multiple stages. To pick the latest stage, there is a column called attribute order which contains a number from 1 to 5. I want to show the latest stages of the application that are ‘in progress’. I created the following measure to calculate the no of in-progress applications as follow:
In Progress Applications =
Var _table = SUMMARIZE(FILTER(‘Main Table’,‘Main Table’[Application_Status__c] = “In Progress”),‘Main Table’[App_ID],“Attribute order”,Max(‘Main Table’[Attribute Order]))
RETURN
COUNTROWS(_table)
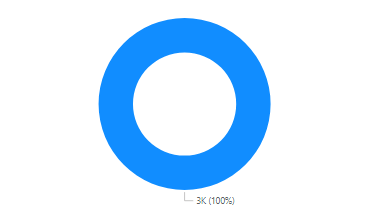
When I used the above measure in card visual it shows the correct number of in-progress applications i.e. 3xxxx (as shown in the figure)
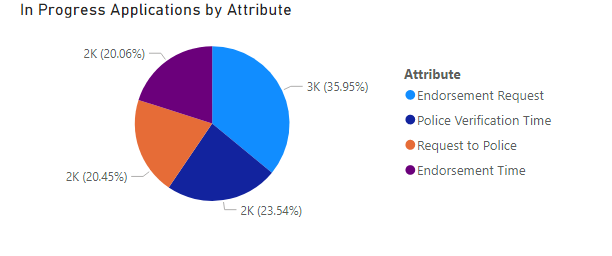
However, when I tried to use the same measure in the pie chart visual and tried to show the split w.r.t to their latest stages, the total number of in-progress applications went to 9xxxx which is not correct. as shown in the picture:
I am not sure how to present the map of the attribute values to the above-mentioned measure. Any help would be really appreciated.
Unfortunately couldn’t find elegant solutions for your request in one measure, so in attach one which works correctly, Based on two additional tables.
First i’ve just correct result for distinct count of App_Id with two filters:
Application Status = equal In Progress
Attribute Order - is Max
So, just to mention when you use Max(‘Main Table’[Attribute Order] ) - it’s returns 5, but not 4 as you could check using filters in Main Table. That’s why In Progress Application number is different.
For just your model we see that only Police Verification Time has values “In Progress” and “4”, but in case that in future other Attribute adds measure will shows it on visualization due to logik.
Hi @leo_89, due to inactivity, a response on this post has been tagged as “Solution”. If you have any concern related to this topic, you can create a new thread.