Using a lookup table to filter a fact table

Hi all,

I’m working on a sales dashboard with sales per customer, product/itemcode, gross/net sales set off against the unit cost price. Getting the correct cost price is the issue in this case, here are some reasons why.

The company is in the petrochemicals industry which means that there are world market prices deriving from oil prices which change weekly.
The company’s main activity is the manufacturing of different types of plastics.
We also sell products of other companies within the group, based upon consignment stocks. We receive stocks without becoming the owner. We receive a commission of 2.5% for that.

Our financial system does not offer any clear, correct and useable reports which can be dumped to excel and serve as a dimension table in Power BI. One of the reasons is that the correct cost price is only registered when the stock value is financially re-valuated during the months close in the first week of the next month.

So the cost price is depending on several conditions of which I have captured some in below statement

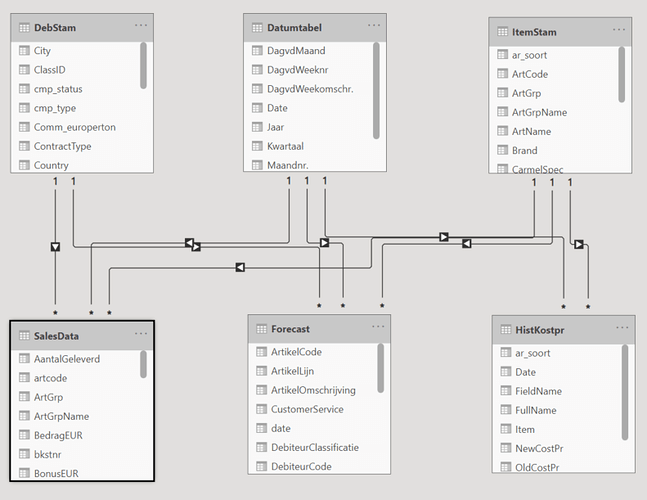
Have a look at my data model below. These are all SQL tables from the ERP system.

Dimension tables at the top are from left to right, customer table, dates table and product table.
The facts table at the bottom are Salesdata (turnover, per order/invoice, per product etc), Forecast table and the cost price history table. The last one is a query which I wrote in the database to get the cost prices.

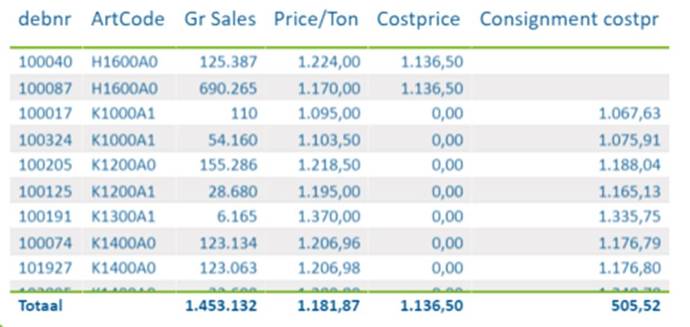
Have a look at a piece of the report I’m building below


You can see 2 cost price columns, the left one being the result of the formula posted above, the other one is the consignment cost price which is 97.5% of the sales price.

My question is, how do I get these prices into one cost price column?

The fact tables contain the products sold but the product dimension table contains the typename which indicates whether it’s a manufactured product or a consignment product.
The variable statement does not let me calculate sales with a condition from a dimension table, or I simply don’t know how.
I have tried this with the Calculate formula, with a virtual table but nothing works. Of course I could add a calculated column to the table with the query editor, but if I remember correctly some of the first lessons from Sam is, DON’T DO THAT!! because you don’t need it. I hope you can help me find another way.

This is my first post so please feel free to let me know if I should elaborate or do something differently in asking my question.

Thanks

Hi @Peter49

Welcome to the forum, you have nicely explained about your issue adding to this is it possible for you to share a sample pbix file.

Hi @Peter49, we aim to consistently improve the topics being posted on the forum to help you in getting a strong solution faster. While waiting for a response, here are some tips so you can get the most out of the forum and other Enterprise DNA resources.

  • Use the forum search to discover if your query has been asked before by another member.
  • When posting a topic with formula make sure that it is correctly formatted to preformatted text </>.
    image
  • Use the proper category that best describes your topic
  • Provide as much context to a question as possible.
  • Include the masked demo pbix file, images of the entire scenario you are dealing with, screenshot of the data model, details of how you want to visualize a result, and any other supporting links and details.

I also suggest that you check the forum guideline How To Use The Enterprise DNA Support Forum. Not adhering to it may sometimes cause delay in getting an answer.

Please also check the How To Mask Sensitive Data thread for some tips on how to mask your pbix file.

Forecast performance dash - v7.pbix (2.6 MB)
Hi Mukesh,

See attached. Hope this works.

Regards,
Peter

HI @Peter49

Looping @EnterpriseDNA, @MudassirAli, @AntrikshSharma

Hi @Peter49

I am not exactly sure regarding the problem statement. If you can specify examples on what is expected and what is coming then I may be able to look further.

Also, if you are able to Solve your issue by creating Calculated Column surely go for it. There is no problem in creating new Columns for Joins, Define Categories etc. Only where we can use Measures instead of Columns for Calculations we shall avoid them.

Thanks
Ankit J

Hello Ankit,

It’s just that I expect it to be possible to be solved with a measure or a virtual tabel or something like that, only I don’t know how to. I guess I need to spend some more time with training.

Meanwhile I have solved this in the SQL query which I’ve used as a source. Thanks for your response.

Regards,
Peter

Reading your full initial post I’m not exactly sure on the requirement but can you examine this.

Costprice combined = 
VAR vTable = GENERATE( VALUES( DebStam[debnr] ), VALUES( ItemStam[ArtCode] ))
VAR CostCalc =
    ADDCOLUMNS( vTable,
        "@CostPrice", COALESCE( [Carmel costpr], [Costprice (old)] )
    )
VAR Result = AVERAGEX( CostCalc, [@CostPrice] )
RETURN

Result

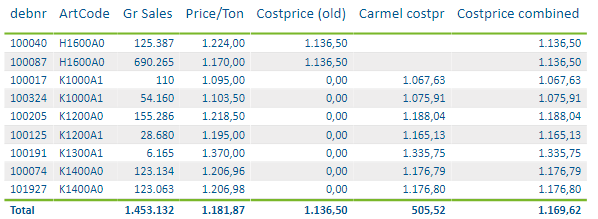
with this result.

image

I hope this is helpful.

1 Like

That is exactly what I was looking for. I was trying to make a virtual table only with ADDCOLUMNS without the first step (vTable) u made and that obviously didn’t work out.

I am not yet familiar with the GENERATE function (amongst many other :woozy_face:), so this adds a lot to some my PBI knowledge and will help a lot with some reports I’m trying to make in PBI.
Thanks a bunch for your help Melissa!

Peter

Hi @Peter49 , did the response provided by @Melissa help you solve your query? If not, how far did you get and what kind of help you need further? If yes, kindly mark the thread as solved. Thanks!

Hi @Peter49 , we’ve noticed that no response has been received from you since the 27th of December. We just want to check if you still need further help with this post? In case there won’t be any activity on it in the next few days, we’ll be tagging this post as Solved. If you have a follow question or concern related to this topic, please remove the Solution tag first by clicking the three dots beside Reply and then untick the checkbox. Thanks!

A response on this post has been tagged as “Solution”. If you have a follow question or concern related to this topic, please remove the Solution tag first by clicking the three dots beside Reply and then untick the check box. Thanks!