Hi Team,
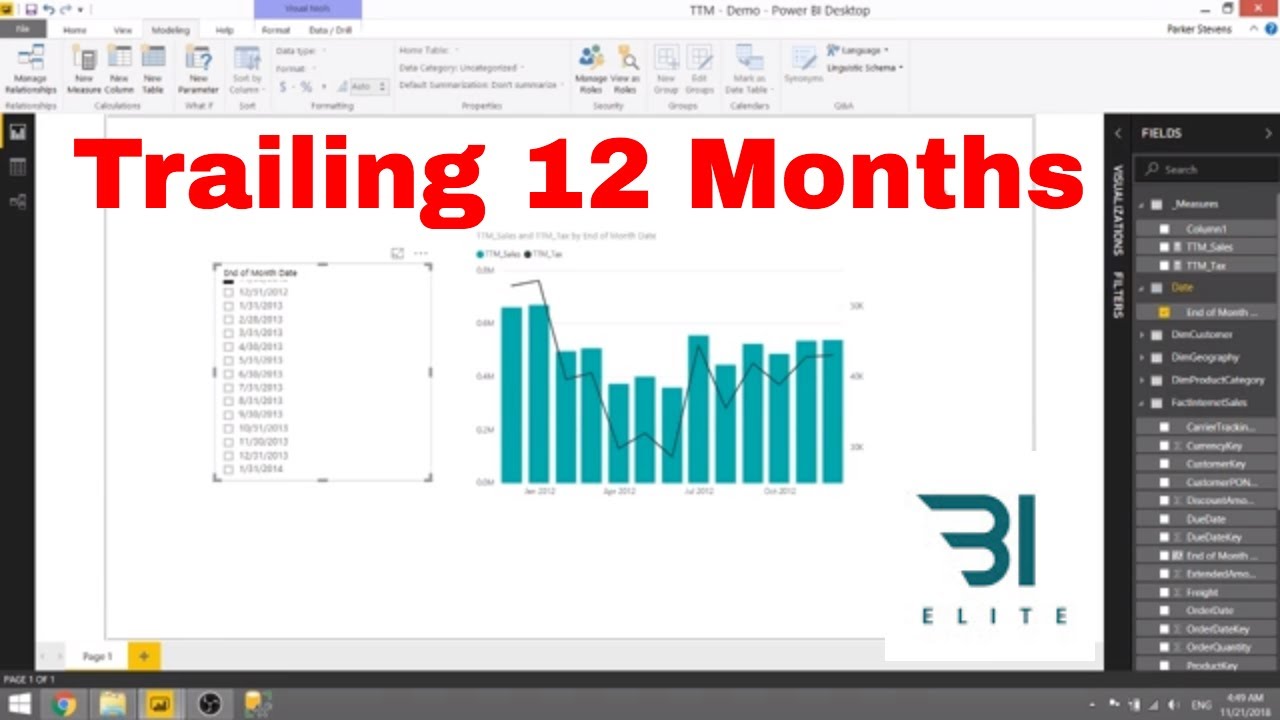
I would like to display only the months (x-axis) in a column chart that are less than or equal to the month selected in a slicer? For example, if I select the month of “May” in my month slicer, the column sales column chart should only show the months of January through May even if June through December has sales data. I have a separate year slicer, so there shouldn’t be an issue with multiple years. I am currently using the following MTD sales measure which is currently pulling in all the months with sales data.
"ActualMTD = TOTALMTD(sum(Sales[Actual]),Dates[Date])
In order words, I want to be able to calculate MTD with a filter, so that the filter sets the display dates on the x-axis to <= the selected value.
Thank you for your help .
Best,
Frank

