Hello you all
I hope you can help me on this one.
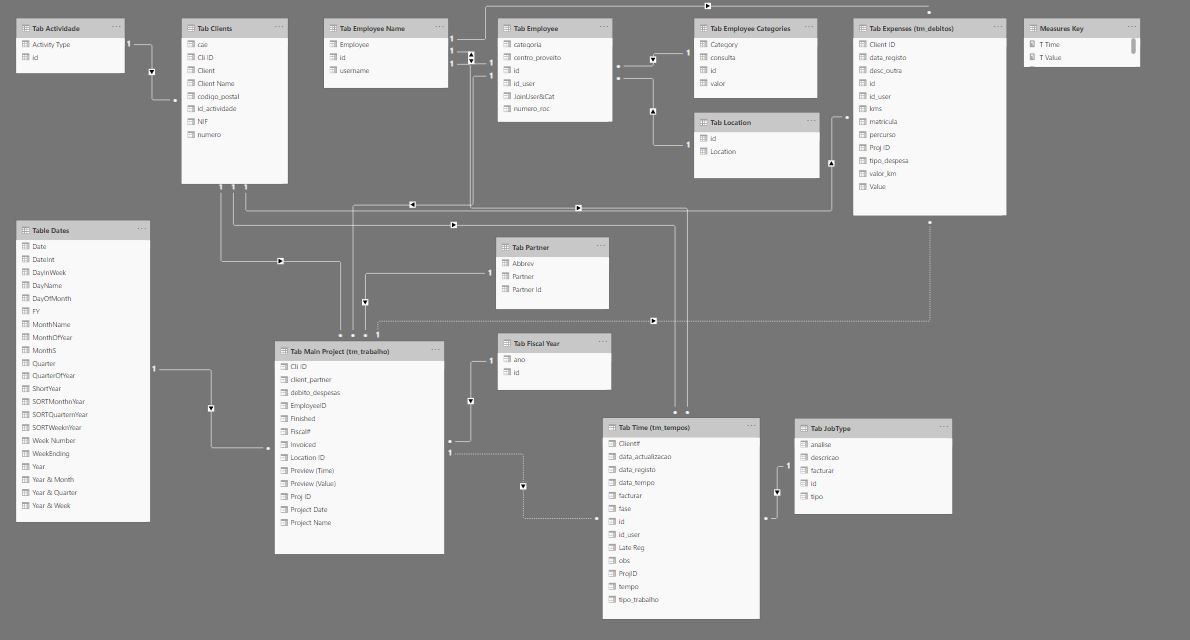
I have 3 tables: Project, Time and Expenses.
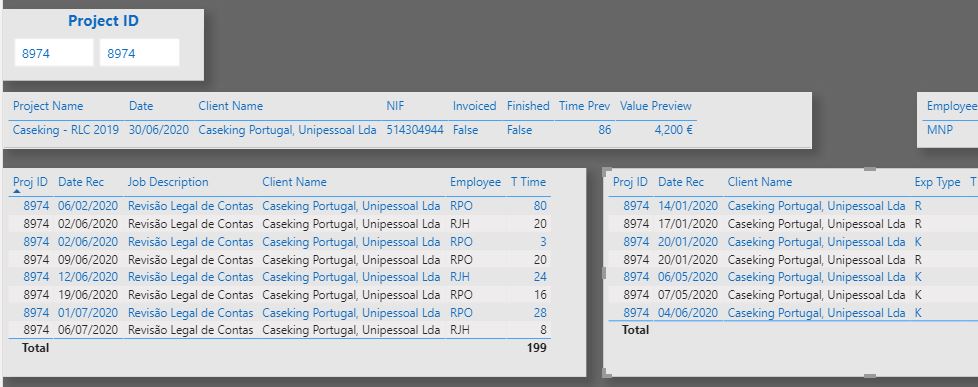
My visual has 1 filter, project number, and it shows all info about this project, when i choose a number. Good. But…i also want to see all the expenses (Expenses Table) and all the time for each task of this project (Time Table). These 2 tables are connected with the Project table by the project number (pbi add an inactive connection).
My question is, how can i see all those records from both tables in a separate visual for each project number? Like a table visual for project, another table visual for expenses and another for time.
Let me know if i didn’t give you all the info?
Thanks a lot
Pedro
From your description, I don’t think you should have any inactive relationships - just a 1:M active unidirectional relationship from Projects to Expenses and an active 1:M unidirectional relationship from Projects to Time Billings. For the visuals, just drag the Project # from the Projects table as your table or matrix row and then whatever fields or measures (i.e., simple Total Expenses and Total Time measures) you want to include in your visuals.
If I’ve misunderstood the question, please post a copy of your PBIX file and a mockup of the results you want to achieve.
Thanks.
- Brian
P.S. If you have the option for Power BI to automatically recognize relationships turned on, PLEASE turn it off. It’s a terrible feature - only you should be making decisions about the structure or your data model…
Hello Brian,
So glad you answer me…on a saturday! And i don’t think you misunderstood my question.
So, i’ve tried to make that connection active to show the result:
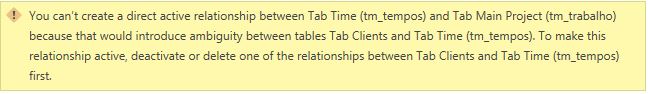
I know why it is, and i have to mantain the other connections active, from Time Table and from Expenses table.
Bottom line, could i make this work if the connections of these both tables were different than from the Main Project table, right? IS this correct?
Is there any way of doing what i want but keeping those connections inactive?
I don’t have any problem to show YOU my pbi file but send me your email because this pbi file has 14 tables.
Thanks a lot Brian
It definitely would be helpful to have the PBIX to get the full picture. Per the rules of the forum, all business needs to be conducted on the forum, not offline. Thus, if the 14 tables brings the file over the 4mb limit of the forum, it’s fine to post it as a OneDrive, Google Drive or Dropbox link.
Thanks!
- Brian
Hey Brian
I totally agree with you but i think i got a solution…please let me know if you agree with me.
Those 2 tables, i’ve merged them with those tables that were in “the middle of the “conflict”” and once i got to activate the connection to projects table it worked. Ok, i lost some info about the clients and the employees, but for this visual purpose, it’s fine.
Later, if i need some more info about those tables i’ll just merge them.
I would prefer to make a virtual table (2 in this case) and put them each one in a visual but this solution, for now, it’s good. Later i’ll learn how to make virtual tables filtering by the id project on the third table.
Like this:
I’ve tried this:
Data Expenses =
SUMMARIZECOLUMNS(
  'Tab Expenses( tm_debitos )'[Proj ID],
  'Tab Expenses( tm_debitos )'[Client Name],
  'Tab Expenses( tm_debitos )'[Date Rec],
  'Tab Expenses( tm_debitos )'[Employee],
  'Tab Expenses( tm_debitos )'[Value]
)
This is not working the way i want because i want only the records of the selected project ID above, first table.
So, is there any way of filtering this table something like this:

FILTER Tab Main Project [Proj ID] = Tab Expenses [PRoj ID] or should i do it with a VAR?

Can you help?
Thanks a lotGlad to hear you got the modeling conflict resolved. I think your approach is fine – denormalizing tables is perfectly acceptable within Power Bi, and Is often a good strategy for resolving data modeling issues. It will result in some duplication of values and thus potentially a performance hit, but the Vertipak compression engine within Power Bi Is extremely efficient in dealing with this and thus the performance penalty may be negligible in many cases. SQLBI has been doing a great video series on Performance Analyzer and Vertipak Analyzer that I would recommend you check out.
In terms of your question about filtering virtual tables, I first wanted to check how you created that example table. I think what you are referring to as a “virtual table” is actually a physical table created via DAX (using the Modeling, New Table command). If that’s the case, then you can join that table to your data model using active or inactive physical relationships, and filter it just as you would any other table. However, if it is truly a virtual table that exists only in memory within the context of a measure, then you can’t join that physically to your data model, but have to use TREATAS to transfer filters between it and the tables of your data model.
I found TREATAS to be one of the more challenging DAX functions to master, but once you do it becomes one of the most powerful and versatile tools in your toolbox. Here’s the video from @sam.mckay that finally clicked on the lightbulb for me re TREATAS:
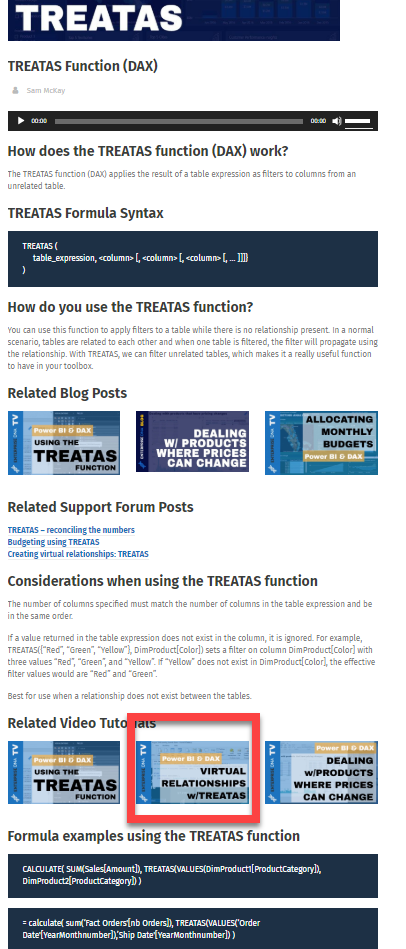
I hope this is helpful.
- Brian
1 Like
Hi @BrianJ
You’re absolutely right about it, and it is a physical table created via DAX. What a great tip by connecting it to a table!!! So good!
And now you got me curious on those “virtual tables”. I’ve already bookmark that video to c it later.
Thank you so much for your help.
Best regards
Pedro