Understanding RANKX with additional fields

Hi all,

I hope someone can help me with the RANKX. I don’t know it is just me, but I seem to regularly get stuck with RANKX?!

Please see attached sample report using dummy data:

Ranking with additional columns.pbix (183.2 KB)

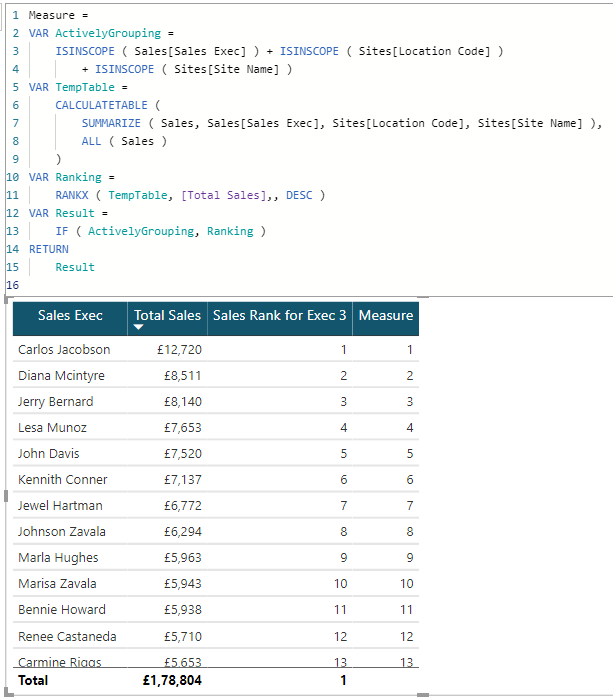
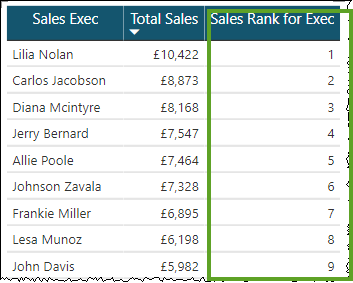
We need to show in a table, the ranking of Sales by Sales Executive. I have this working in a simple table using the measure below:

Sales Rank for Exec = 
RANKX (ALLSELECTED ( Sales[Sales Exec] ), [Total Sales], , DESC, DENSE)

image

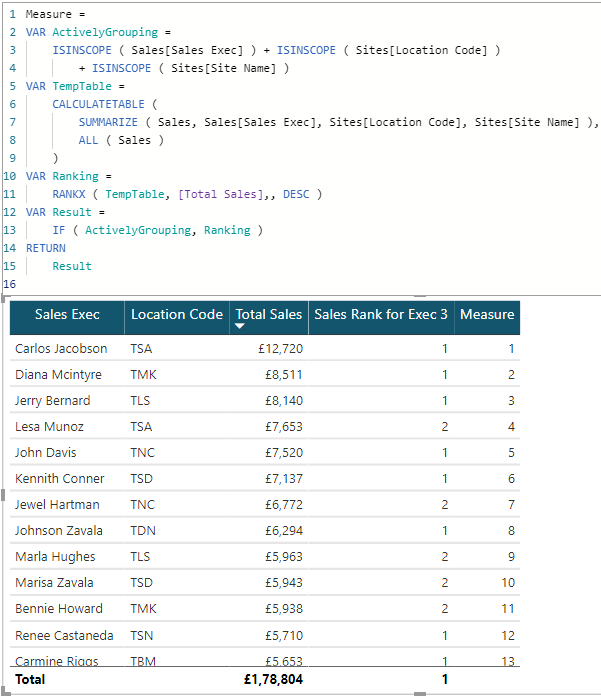
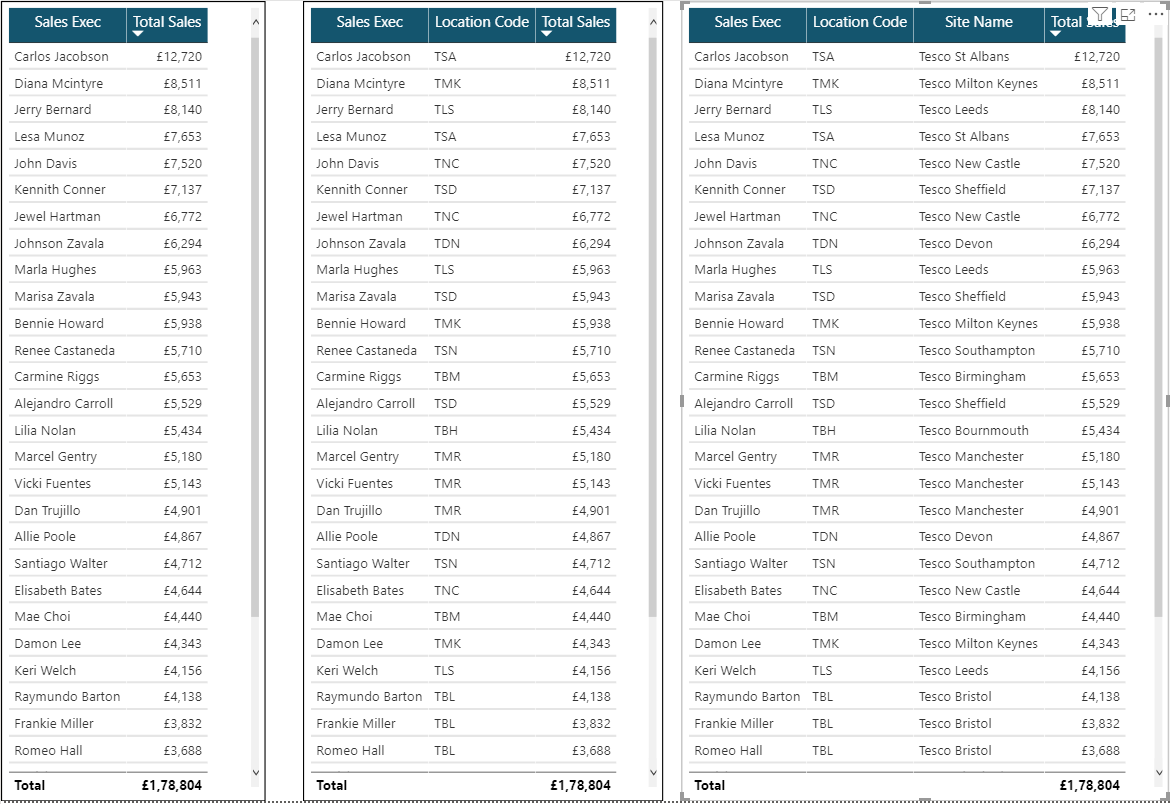
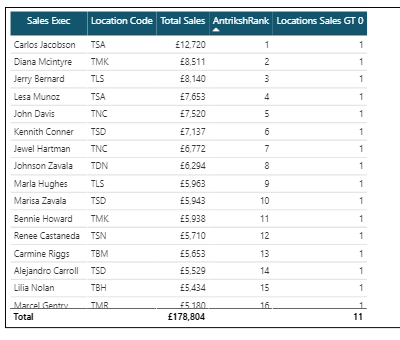
However, if I add another column to the table to give our users some additional context, such as the ‘Site’ where the Sales Exec works (from dim table [Sites]), the ranking breaks:

image

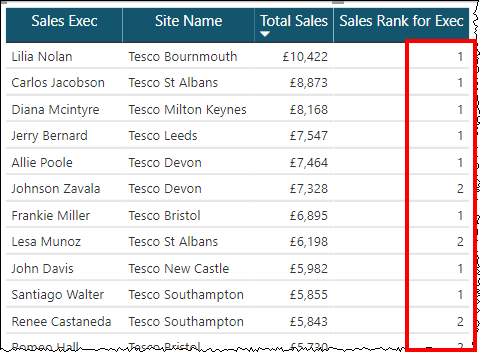
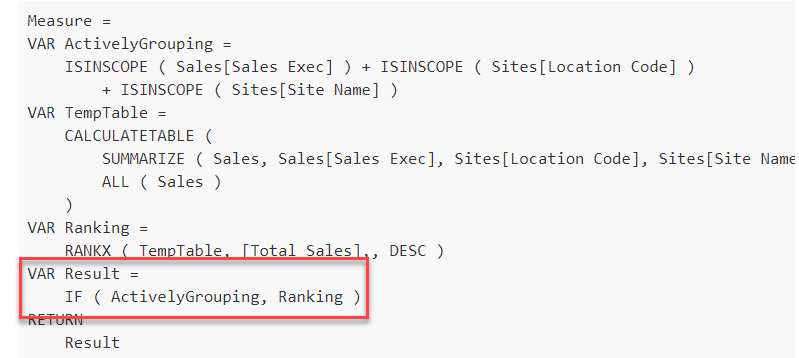
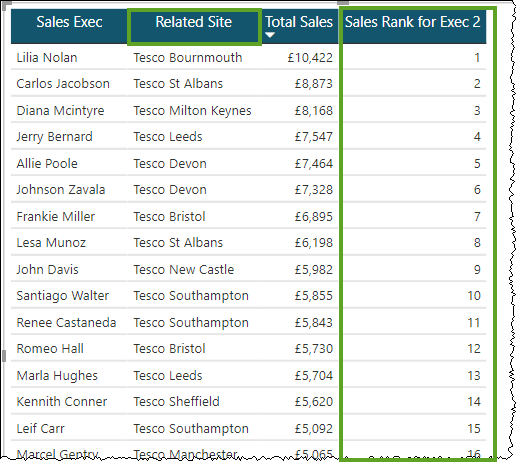
The only solution I have found, is to bring the ‘Site’ column into my Sales fact, using RELATED and then to adjust my ranking measure to do a CROSSJOIN:

Sales Rank for Exec 2 = 
RANKX (
    CROSSJOIN (
        ALLSELECTED ( Sales[Sales Exec] ),
        ALLSELECTED ( Sales[Related Site] )
    ),
    [Total Sales],
    ,
    DESC,
    DENSE
)

image

If we are then asked to add another column, again to provide further information to the users, such as Sales[Location Code], the measure needs to be adjusted again to work:

Sales Rank for Exec 3 =
RANKX (
    CROSSJOIN (
        ALLSELECTED ( Sales[Sales Exec] ),
        ALLSELECTED ( Sales[Related Site] ),
        ALLSELECTED ( Sales[Location Code] )
    ),
    [Total Sales],
    ,
    DESC,
    DENSE
)

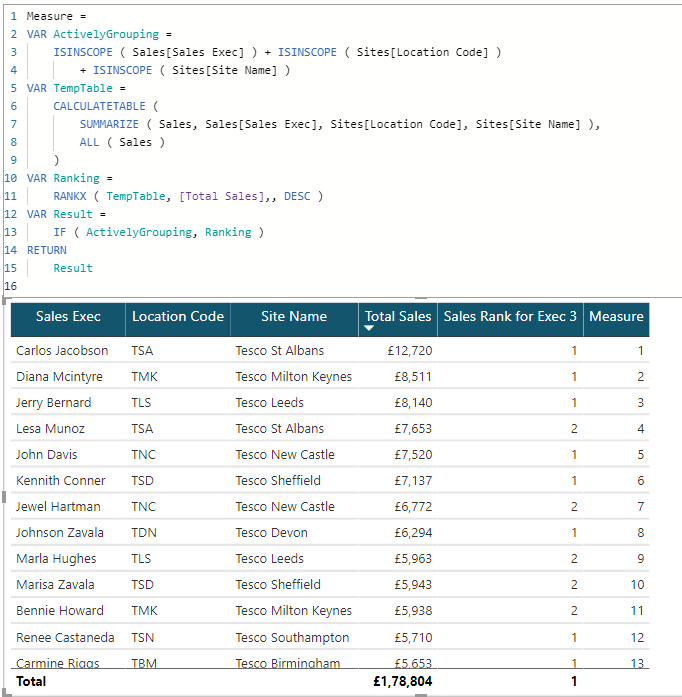
In reality, we are being asked to output many information columns coming from a few different DIM tables, which will involve lots of Cross joins and many RELATED columns being added to my fact table, which isn’t ideal! Eg:

Sales Exec
Job Title
Site
Division
Manager
Total Sales
Sales Rank

Is there a better to way to handle this?

Many thanks

Mark

1 Like

@Mark Try this:

Measure =
VAR ActivelyGrouping =
    ISINSCOPE ( Sales[Sales Exec] ) + ISINSCOPE ( Sites[Location Code] )
        + ISINSCOPE ( Sites[Site Name] )
VAR TempTable =
    CALCULATETABLE (
        SUMMARIZE ( Sales, Sales[Sales Exec], Sites[Location Code], Sites[Site Name] ),
        ALL ( Sales )
    )
VAR Ranking =
    RANKX ( TempTable, [Total Sales],, DESC )
VAR Result =
    IF ( ActivelyGrouping, Ranking )
RETURN
    Result

7 Likes

@AntrikshSharma;

Brilliant. There are multiple constructs here I’ve never seen used in that way before. This is a mini DAX master class.

  • Brian
2 Likes

@AntrikshSharma,

Okay, I’ve been pulling this apart for a while now, and I still can’t figure out how the Result variable is working. What exactly is this statement doing, given that it seems that ActivelyGrouping returns the total number of statements that are true? And how is the result of this variable properly filtering the columns to be included in the TempTable variable virtual table?

Thanks in advance for the explanation - definitely learning a lot from this one.

– Brian

@BrianJ I had the same thought too, but the thing is the columns ( Location code and Site name ) from the sites table are not changing the granularity of the report or the virtual table at all.

That’s what makes it look like something strange is going on with the code, otherwise ActivelyGrouping is just to check whether the columns are included in the report so that ranking can be removed from grand total.

@AntrikshSharma,

Ahhhh, OK. This works because this:

Locations Sales GT 0 = 
CALCULATE(
    DISTINCTCOUNTNOBLANK( Sales[Location Code] ),
    FILTER(
        Sales,
        [Total Sales] > 0
    )
) 

evaluates out to 1 for every sales rep.

image

If that weren’t the case, this code would not work as is, and you’d need something like a switch statement to create different TempTables within the measure based on the fields chosen, correct?

Don’t get me wrong – what you’ve done here still super cool, but I thought you had somehow developed a generalizable approach that was magically handling changing granularities.

As always, thanks for the additional explanation.

  • Brian
1 Like

Correct. one more thing IF and SWITCH statements can’t return tables.

Haha, IKR, I thought so too! Cheers!

1 Like

Hi @AntrikshSharma

In your solution this is something i don’t understand. Though this is the first time i have seen use of Isinscope fucntion with “+”.

VAR ActivelyGrouping =
ISINSCOPE ( Sales[Sales Exec] ) + ISINSCOPE ( Sites[Location Code] )
+ ISINSCOPE ( Sites[Site Name] )

I can think of Using “Or” in some way but use of “+” is entirely new. What was your thought process for using “+”. I can resolve that every time each isinscope is true it will return a binary 1 but when when all 3 isinscope are true they are returning 1 instead of 3. I am unable to figure out this.

Regards,
Hemant

I guess i have figured it out. In binary Operations + is a logical “Or” and * is logical “And”. I must say this is a wonderful use of isinscope. I will remember it always.

Learned something new today.

Thanks @AntrikshSharma

1 Like

@Hemantsingh Correct, I learned this long ago while working with Excel, example:

OR = SUMPRODUCT ( ( A1:A10 = “a” ) + ( A1:A10= “b” ) )
AND = SUMPRODUCT ( ( A1:A10= “a” ) * ( A1:A10= “b” ) )

2 Likes

Hi @AntrikshSharma

Thank you very much for your solution! It is so much better than the one I had found using CROSSJOIN and the need to add all those columns to our Sales fact using RELATED!

Also digging the very neat INSCOPE checks!

Many thanks again,

Mark

1 Like