Understand the difference between SUMMARIZE and ADDCOLUMNS

Can you include the file too?

Hey @Tibbie

In a nutshell summarize +Addcolumn combo is identical in terms of functionality as Summarize. The only thing that differentiate them is the calculation time. In other words, you can create a calculated column within a Summarize function too (I usually use Summarize to create virtual tables) but when you execute it on the report canvas it will take long time. Now if you create same calculated column using addcolumn and summarize duo the time to complete the operation will be very less.

Also, summarizecolumn in nothing but syntax sugaring of Addcolumn and summarize duo. Whenever you write a funtion using summarizecolumn behind the hood it will always behave like summarize+Addcolumn duo.

Hope this help in understanding. Happy to help.

Regards

Hi @Hemantsingh,
Thanks for the info so I tested out all three functions in a newly created table to just see the result of the virtual tables.

Both Addcolumn and Summarizecolumn provides the same result

Summarizecolumn()

Addcoulmn()

but Summarize() provides something else

and when I try to use the code/functions within a SUMX() they give me different results when I slice on DimProduct Category3 and that is what confuses me :confused:

image

Hi @Tibbie,
As you already mentioned, there are some best practices when using these functions:

  1. Summarize is used for grouping fields from dimension, but not for aggregating data. Summarize has additional parametar for providing columns for grouping.
  2. AddColumns is used to add aggregations to data created by Summarize function
  3. SummarizeColumns is newer function that does formula from above. It is optimized for both grouping and creating aggregations, plus it has parameters for filtering

In my experience, if you are not sure what data is being generated in the back-end, i prefer testing it as creating new table. Attached examples of how these functions work and what are results:

Regards,
Nemanja

Hi @nemanja.andic,
Oh okey, i forgot the table name then! Thanks for clearing that out!

So the result i was looking for was this without VALUES as your third and forth example.
SUMMARIZE (DimProduct, 'DimProduct'[PIDkey]
instead of
SUMMARIZE ( VALUES('DimProduct'[PIDkey])

but how do your wrap your forth example (since Summarizecolumn is supposed to be the most effective function performance wise) in a SUMX() ?

I tried with this, but dosnt work

VolumeImpact (summz) =
SUMX (
    SUMMARIZECOLUMNS (
        'DimProduct'[PIDkey],
        "VolImpact", IF (
            ISBLANK ( [Avg Revenue Price LY] ) || ISBLANK ( [Avg Revenue Price] ),
            0,
            [Δ Units Rev LY] * [Avg Revenue Price LY]
        )
    ),
    [VolImpact]
)

@Tibbie, below is example of demo measure using SummarizeColumns (from above) inside Sumx.

Summarize vs AddColumns 2

Could you share the error you receive? Based on formula structure, it seems ok.
Try adding if statement in aggregation = … “VolImpact”,sum(if…

Okey @nemanja.andic
i tried your example as well but got this error msg on both the first above and your example
image

VolumeImpact (summz) =
--Δ Volume LY * Price LY
VAR SUMC =
    SUMMARIZECOLUMNS (
        'DimProduct'[PIDkey],
        "VolImpact", 
        IF ( ISBLANK ( [Avg Revenue Price LY] ) || ISBLANK ( [Avg Revenue Price] ),
            BLANK (),
            [Δ Units Rev LY] * [Avg Revenue Price LY]
        )
    )
RETURN
    SUMX ( SUMC, [VolImpact] )

@Tibbie, it seems the issue comes at “If statement” part.

Could you try out this approach:

Sumx SummarizeColumns Test v2 =

– [Test measure] and [Sumx SummarizeColumns Test] are my dummy calculations

VAR pMeasure =
CALCULATE (
IF (
ISBLANK ( [Test measure] || ISBLANK ( [Sumx SummarizeColumns Test] ) ),
BLANK (),
[Sumx SummarizeColumns Test]
)
)
VAR pProductCount =
DISTINCTCOUNT ( Sheet1[Product Id] ) – pMeasure returns total, need to divide it by number of rows for my demo
VAR pMeasureFinal = pMeasure / pProductCount
VAR pSummarizeColumns =
SUMMARIZECOLUMNS ( Sheet1[Product Id], “Aggregation”, pMeasureFinal )
RETURN
SUMX ( pSummarizeColumns, [Aggregation] )

1 Like

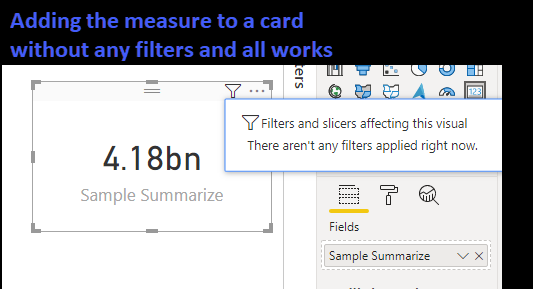
SUMMARIZECOLUMNS cannot be used in a measure if that measure has filter context, which pretty much everything does. For example (using the Contoso Database) we want to summarize sales by calendar year and country. Using SUMMARIZECOLUMNS we can write:

Sample Summarize = 
SUMX(
    SUMMARIZECOLUMNS( 
        'Date'[Calendar Year]
        ,Customer[Country]
        ,"Sales"
        , SUMX( Sales, Sales[Quantity] * Sales[Unit Price])
    )
,[Sales] 
)

image

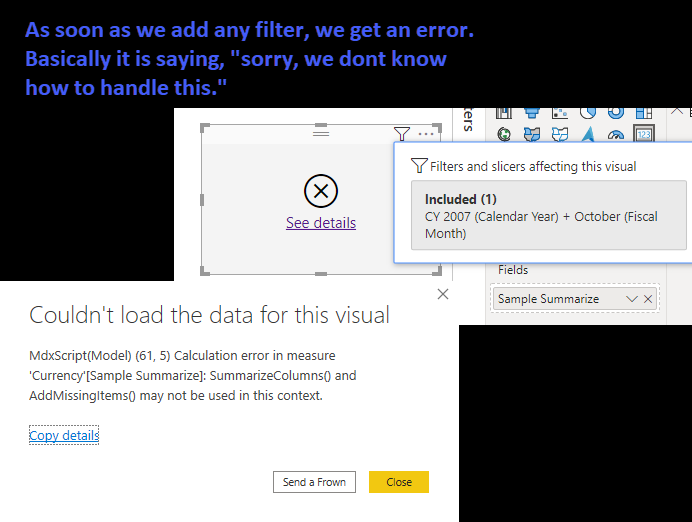
But as soon as we apply a filter:

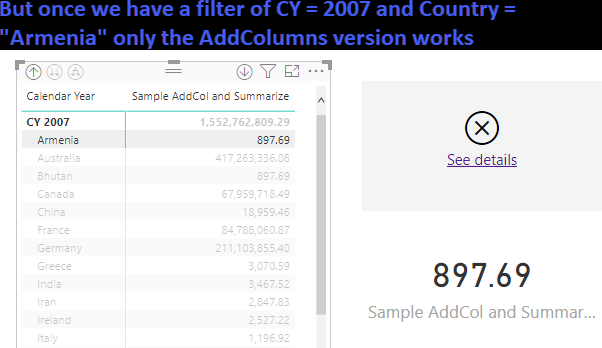
But when we use AddColumns and summarize:

Sample AddCol and Summarize = 
SUMX(
    ADDCOLUMNS(
        SUMMARIZE( 
            Sales
            ,'Date'[Calendar Year]
            ,Customer[Country]
        )
    ,"Sales"
        , CALCULATE( SUMX( Sales, Sales[Quantity] * Sales[Unit Price]))
    )
,[Sales] 
)

image

There are a few reasons why you want to use the AddColumns/Summarize pattern rather than just adding a column in Summarize itself. Usually they will produce the same result, but there can be times where SUMMARIZE just has output that makes no sense. But the main issue is that SUMMARIZE will result in poorer performance and that has to do with the fact it will scan your tables to summarize and then basically scan them again to add each calculated column. So if you have 3 calculated columns that is three scans plus the original one to group them. AddCol/Summarize has a much more effiecient query plan and performance is much better.

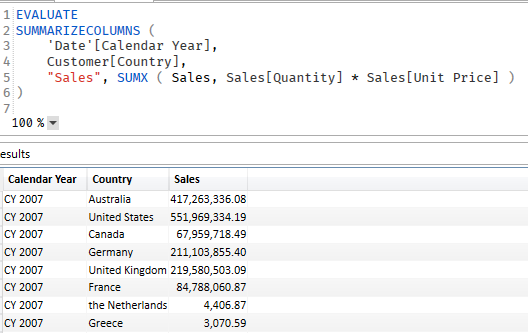
If you ever exported the performance data from PBI into DAX Studio you will see that PBI uses SUMMARIZECOLUMNS a lot in the queries it is producing. It is more efficient than AddCol/Sum. but really is only good for querying and not so much for measures. Works as you would expect when querying:
image

Hope that helps clear it up.

7 Likes

Thanks everyone for the help and thanks @Nick_M for a detailed explanation.

I did go for SUMX( ADDC with VALUES which produced the result i expected and was the fastest one :slight_smile:

Well done Nick, great explanation! Thanks

Thanks for this explanation, which I’m still trying to digest (being a beginner). This kind of complexity is a huge impediment to learning DAX and using PowerBI for the beginner. I’m working through the Mastering DAX E-DNA course and this issue is not mentioned in the section on Summarize. Is there a good source on best practices for summarizing columns in a measure where there will be filter contexts, as well as any other gotchas?

Hi @mpchean Thank you for your followup question .

I request you to have a look at following article , which should clear out most of your confusions as you listed .

1 Like

Thank you @Dhrubojit_Goswami.
That piece indicates that Summarize should not be used - at all. I read it earlier but the whole discussion of the clustering is beyond my PowerBI understanding. Is there any chance do you suppose that PowerBI might make use of SQL at some point? A lot of other data analysis tools do.

@mpchean The DAX code you write does get converted into a xmSQL statements which is almost similar to SQL. watch these videos to get an idea:

1 Like

Thank you @AntrikshSharma. This would make a good E-DNA tutorial for those transitioning from SQL to DAX. I couldn’t find part 2 - could you link to it please?

@mpchean Yeah, I @BrianJ thought we could make a great course on this, so we will be releasing one soon.

@AntrikshSharma why didn’t they just settle on SQL for the data modeling language, seems that would have been the path of least resistence?

@mpchean No idea, maybe because Power BI is targeted towards Excel and Business Analysts who don’t have to learn SQL, but funny thing is they ended up creating 2 complex languages instead lol.

@AntrikshSharma so true - so sad.