Hi Experts,
I am working on this file and have setup data model and some DAX.
Now when i try to filter attributes my graphs are not getting filtered.
Can someone plzz help and guide.
Thank you.
@EnanBahadur I’ve checked your PBIX and CSV data.
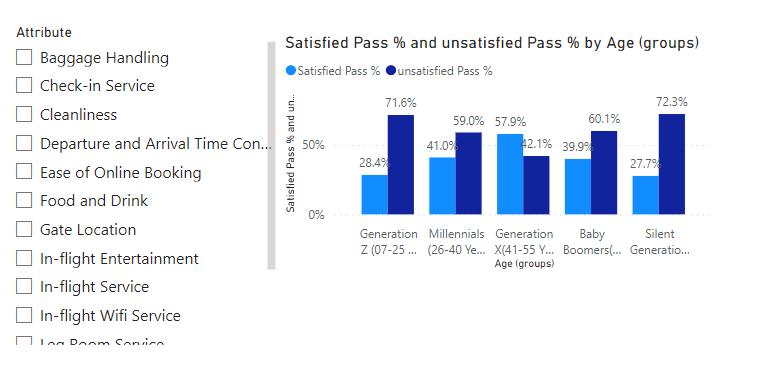
The Attribute slicer is working properly but you might wondering it’s showing the same value that’s because you did Unpivot in the Power Query which result the same records for each Attribute. Thanks
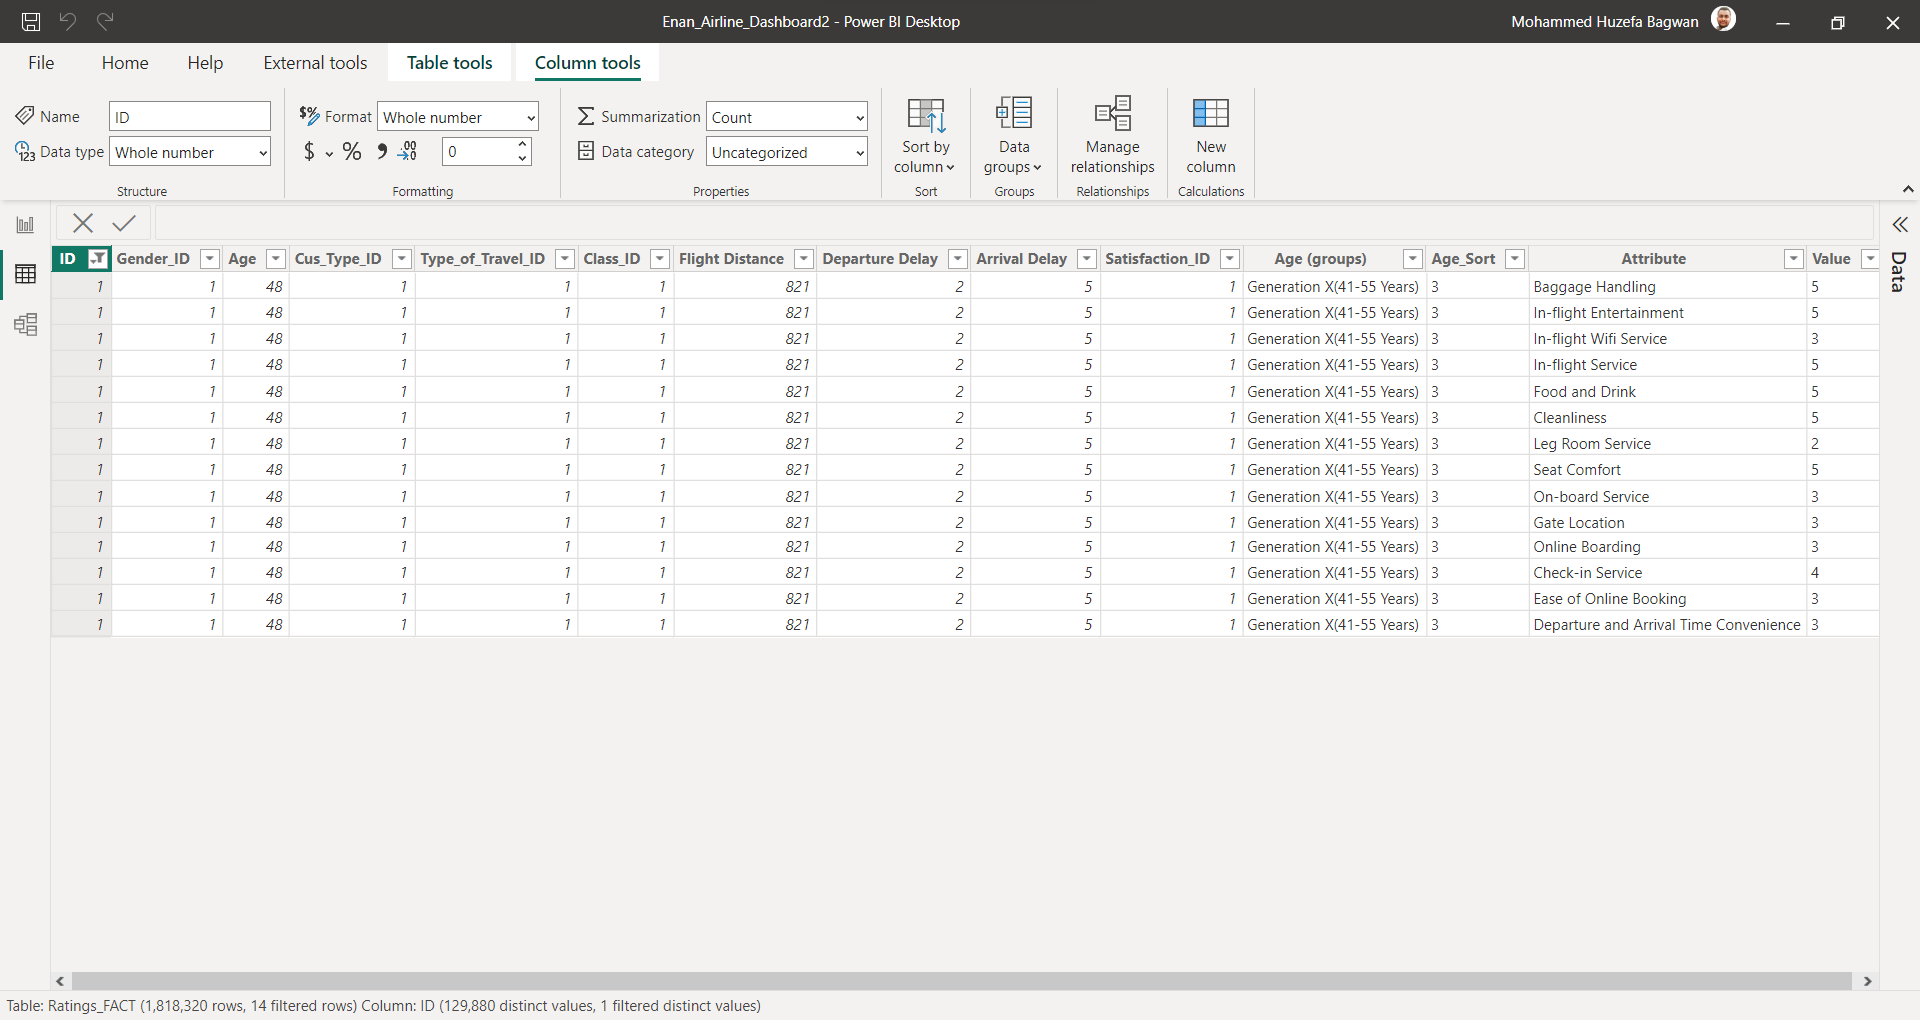
@EnanBahadur I think your are doing wrong analysis.
For an example, the below attached screenshot is for Ratings_FACT table.
I did filter for a one ID and I see that it will have all the attributes and if you use as a slicer then it will show one single record for each ID since you are taking DISTINTCOUNT.
hi @MohammedHuzefaBagwan
Thank you for guiding, yes if i filter from the data view it show only one record.
But still its not showing filtering the visuals and also drill through page not working.
I am attaching the updated file.
Can you please advise what is the solution, i need the filter and drill though to work.
Thank you so much. Enan_Airline_Dashboard3.pbix (8.3 MB)
Hi @EnanBahadur. It is not encouraged to call out specific members on the forum. Not only is it outside the normal operation of the forum, but also will discourage any other forum members from pursuing your issue. Greg
In regards to the drill through, on the drill through page, you need to place the fields such as attribute, class etc instead of the measures, and then on the visuals on the other page, once you click on the visual, the menu drill through at the top will allow you to turn on drill through. That seemed to show the option for me.
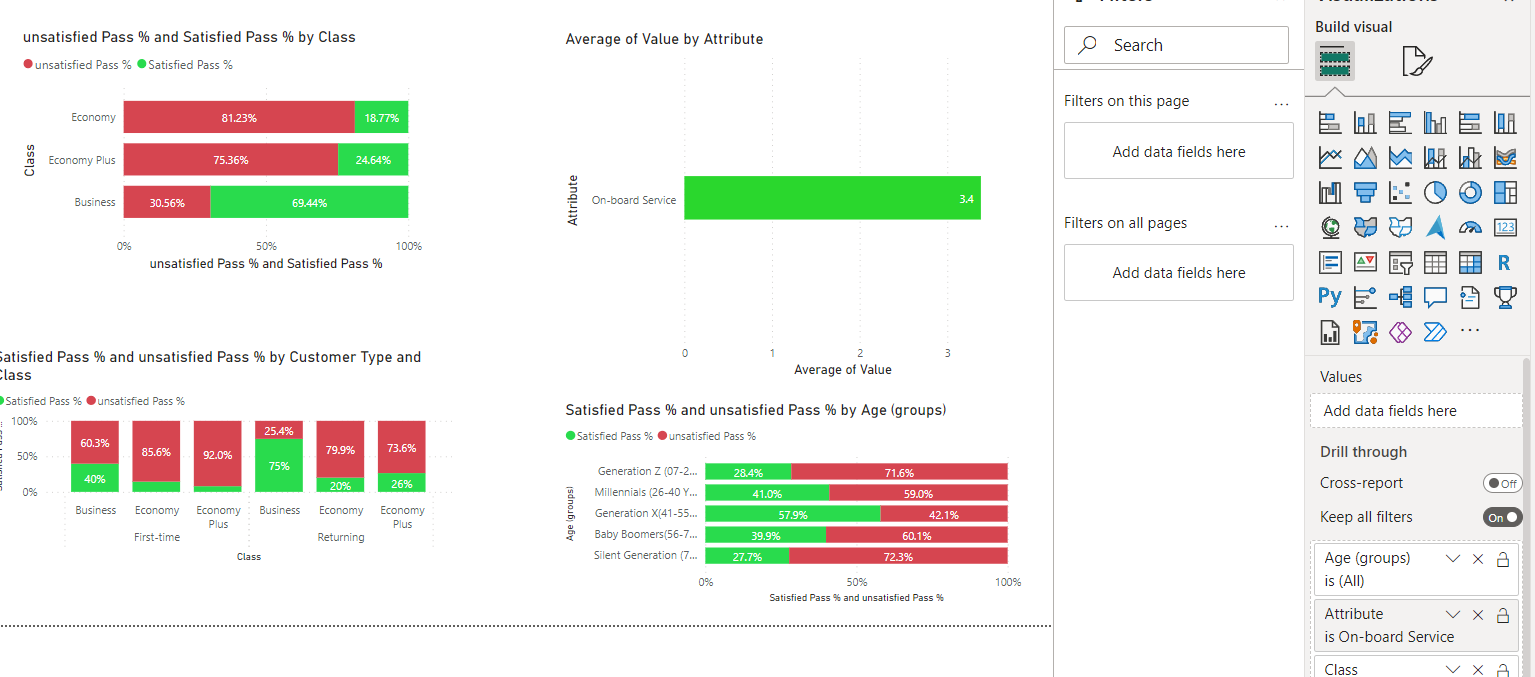
As for the analysis, if you look at your steps in PQ, you are merging a customer to a satisfaction ID, that ID is on the customer granularity, you then unpivot for all attributes, so they all get the same satisfaction level and as all customers have the same attributes nothing changes when filtered.
If you add the satisfaction ID value in a calculated column after unpivoting so each attribute gets a rating based on its own score then you would start to see changes as they would not all be the same.
Have you now resolved the rating to be a rating per attribute, and can you share the sample file, so the forum can offer advice?
You need to add the field to the drill through page, not the measure in this case, each item you are drilling through on needs to be in the drill through area, then the drill through option has to be selected on each visual, it should then show up.
In regards to the drill through page, you need to place the fields in your visuals in the drill through section not the measures, and it looks like some visuals use fields from the FACT table and others from the DIM tables, so it could get a little messy.
Once you put the correct fields in the drill through filters, you can go to the page with the graph select the visual and in the ribbon under Drill, select the drill through icon to allow drill through, once done you can use the item in the right click menu, it will show the filters currently in place in grey, so you can see that it does work.
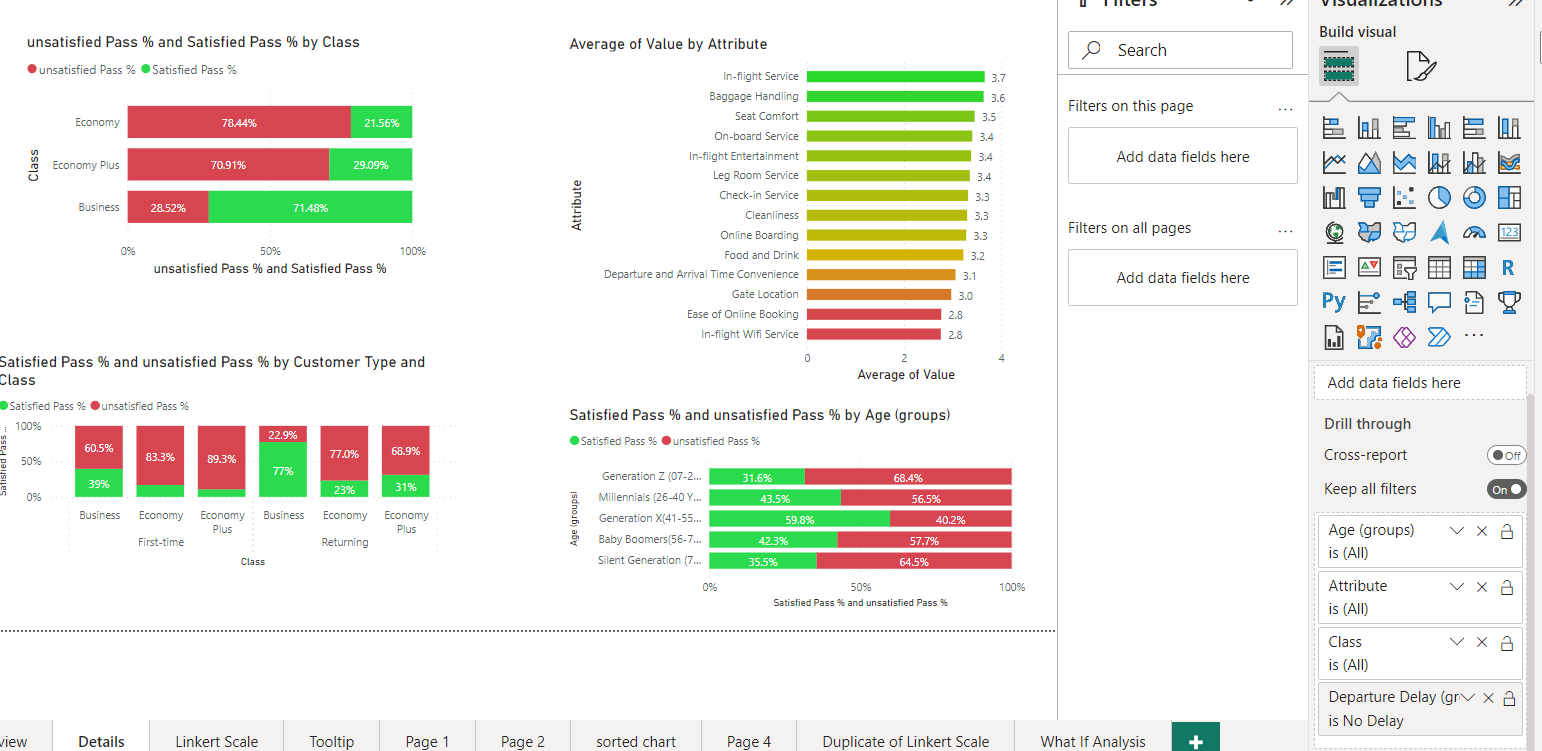
You need to bear in mind the analysis you are doing also, within attribute, if every flight contains all the attributes, regardless of which you select all flights will be included so between attributes all other statistics may seem the same. Where as if delay type is drilled through the attribute ratings will change as this changes the population.
Edit, this will also affect the slicer, what ever attribute you select, they are all present in each flight, so all flights will be present, it will appear like nothing changes, it may be that you have to explore your data and see what analysis works best.