Hi
Logic and Setup
An order is considered a FAILURE if one or more lines on the order matches either (or both) of the following:
• The order line has an actual dispatch date later than the expected dispatch date
• The order line has an actual dispatch quantity less than the expected dispatch quantity
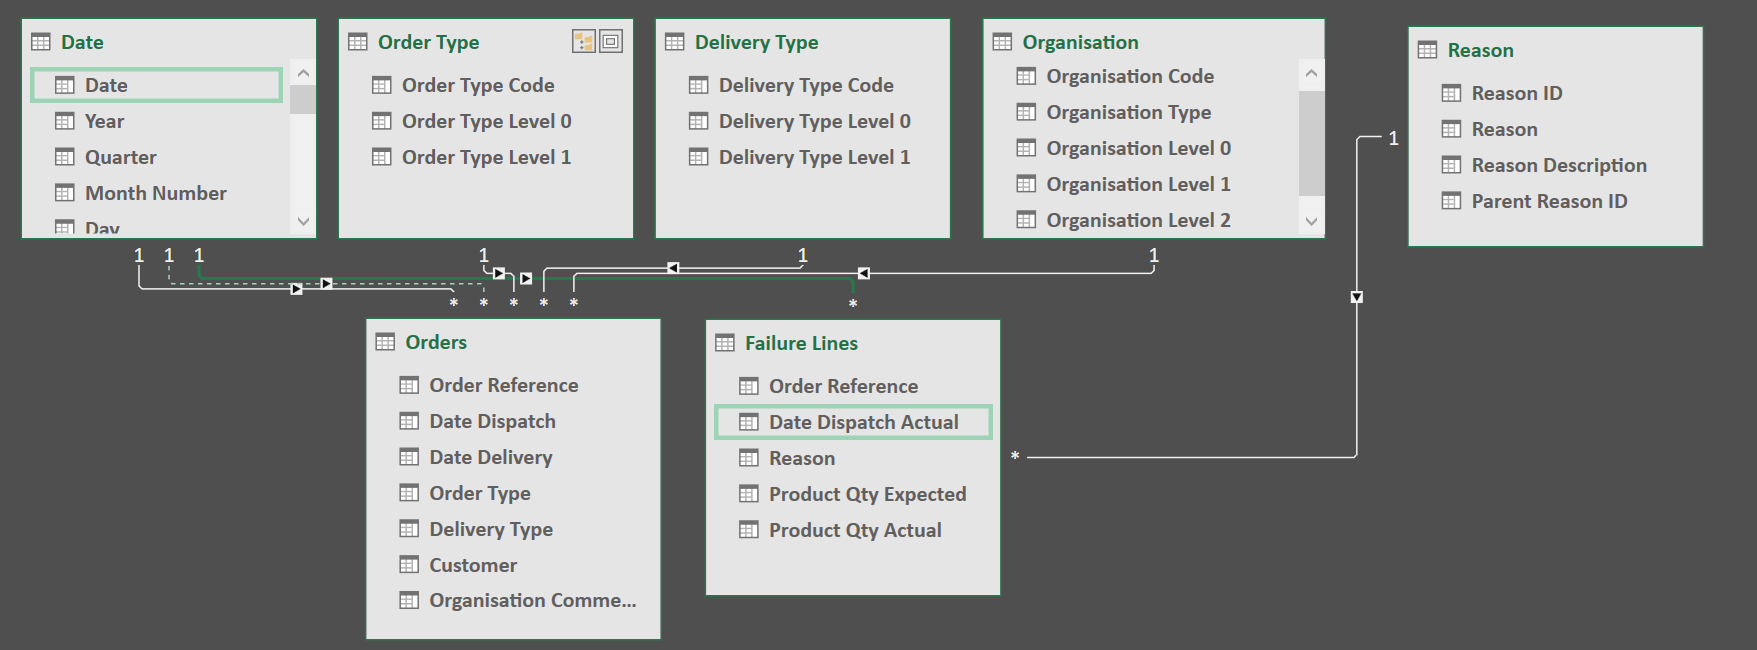
All orders dispatched are recorded in the ORDERS fact table.
Orders are categorised by ORDER TYPE, DELIVERY TYPE, and ORGANISATION.
All order lines which failed are recorded in the FAILURE LINES fact table.
Each failure line is attributed a REASON. One order may fail for multiple reasons.
I have posted the image of my model and I need to report on the following:-
My requirements are :-
• Orders Dispatched: Distinct Count of Order References in Orders fact table
• Orders Failed: Distinct Count of Order References in Failure Lines fact table
• Failure %: Orders Failed / Orders Dispatched
• Compliance %: (Orders Dispatched - Orders Failed) / Orders Dispatched
I m struggling with the relationship between the 2 Fact Tables. Would I be better of flattening the the Failures Table into the Orders Table? If not should I relate the two Fact tables via bridge Table that just contains Order Reference or something else? I really would be thankful for any help. I appreciate it is a big ask.
Thanks
Chris
Hi Chris,
I think you already have it with your last paragraph. I think you honestly could do either and it would both work fine, your measures would just be slightly different.
Because I presume that there are many order references I would more likely run with a merge of the table versus a supporting table. Mainly because I Iike anything that becomes a lookup table to be more a summary vs every iteration of something and as big as a fact table usually is.
Either way though I don’t think you can go wrong.
With a merge table I think those measures wouldn’t be too difficult. Are you able to get those you think?
Let me know if I’m missing something and you can’t merge then for some reason.
Sam
Hi Sam
Thanks for the reply.
Looking at it again I wont be able to merge as one order could fail for more than 1 reason so I would presumably then have to go with the Bridge Table with just the reference orderid. I may struggle with the DAX Logic.
Hi Sam
I have just had another thought, if I merge anyway and I am using the DISTINCTCOUNT on Order Reference to build the branching measure. Can you see any issues with that.
Chris
Couldn’t you place say say a filter on the DISTINCTCOUNT measure?
For example;
CALCULATE( DISCOUNTCOUNT( OrderReference), FILTER( Fact Table, Reason <> "" ) )
Something like this (if they were merged). This way you would pick up only the references that are failures as they are the only ones that will have a reason.
Great minds think a like. That’s exactly what I had done. Must be the great training.
Have a good weekend.
Chris
Sam can you recommend one if your many charts that I could use to show the measures that I have mentioned and showing the YTD, qtd and mtd.
Cheers
I’m always on the side of keeping it simple. No different here I would say.
For QTD, YTD to date etc, cumulative totals are really the only way to go I would say. That’s the best way to showcase and compare trends.
Any information showcasing daily results, just stacked column charts.
If using other dimensions like Reasons/Delivery Types - if there’s many different dimension I go for bar chart, if only a few donut or pie charts work well.
Reminds me I should get a one page card together around visual recommendations. There’s a few out there already (some over complicated in my opinion). Will put it on the list of to dos.
Cheers Sam
You have built a fantastic service.
Chris
Chris as I was looking to type this exact question about two fact tables and on-time performance calculating I noticed your excellent questions so now no need.
Is it possible to post an image of your final revised table layout?
Thanks,
Dave