Hi DNA Enterprise,
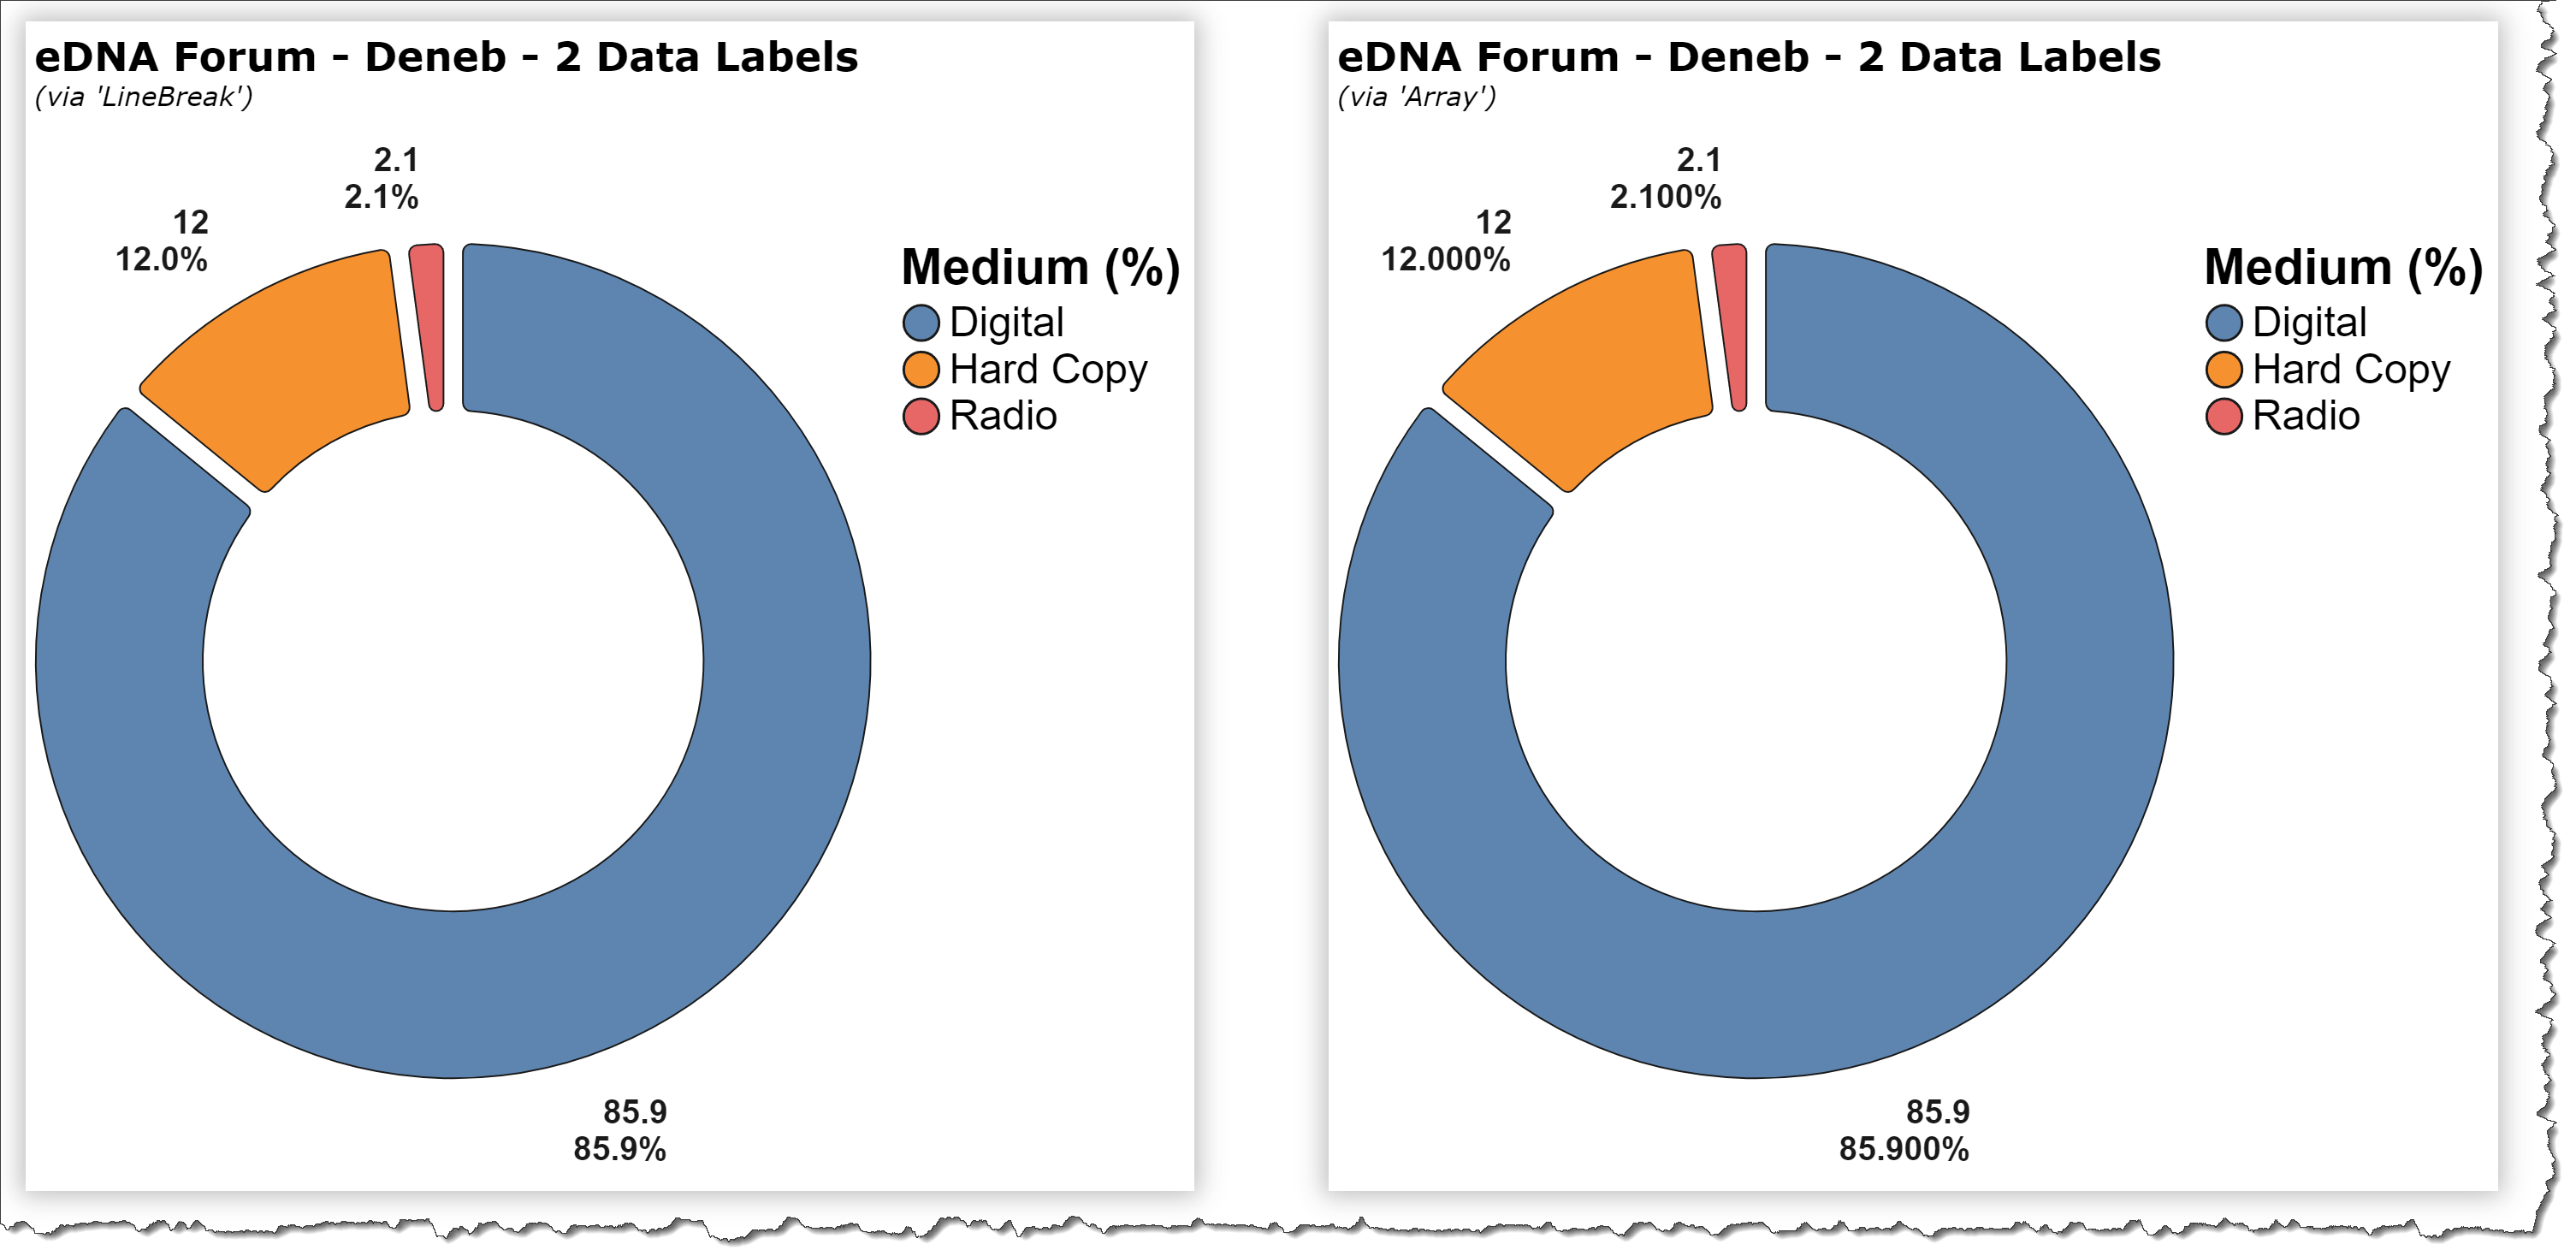
It is possible to have two data labels in deneb, like the actual value and percentage value, in donut chart,
This is should look like
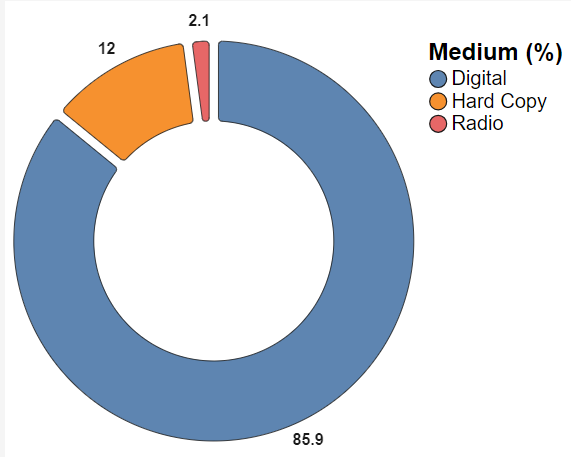
sample deneb visual,(CTTO)
{
“data”: {
“values”: [
{
“Medium”: “Direct Mail”,
“Advertising Share”: 3.2,
“Medium-Type”: “Hard Copy”
},
{
“Medium”: “Posters”,
“Advertising Share”: 3.4,
“Medium-Type”: “Hard Copy”
},
{“Medium”: “Press”, “Advertising Share”: 5.4, “Medium-Type”: “Hard Copy”},
{
“Medium”: “Television”,
“Advertising Share”: 69.8,
“Medium-Type”: “Digital”
},
{“Medium”: “Cinema”, “Advertising Share”: 0.7, “Medium-Type”: “Digital”},
{“Medium”: “Radio”, “Advertising Share”: 2.1, “Medium-Type”: “Radio”},
{
“Medium”: “Internet”,
“Advertising Share”: 15.4,
“Medium-Type”: “Digital”
}
]
},
“transform”: [
{
“joinaggregate”: [
{“op”: “sum”, “field”: “Advertising Share”, “as”: “calc”}
],
“groupby”: [“Medium-Type”]
}
],
“width”: “500”,
“height”: “500”,
“padding”: {“top”: 5, “right”: 0, “bottom”: 5, “left”: 0},
“layer”: [
{
“mark”: {
“type”: “arc”,
“outerRadius”: {“expr”: "(height * 0.5 ) "},
“innerRadius”: {“expr”: "(height * 0.3 ) "},
“stroke”: “black”,
“cornerRadius”: 5,
“padAngle”: 0.04
}
},
{
“mark”: {
“type”: “text”,
“fontSize”: 20,
“fontWeight”: “bold”,
“radius”: {“expr”: “(height * 0.55)”}
},
“encoding”: {
“text”: {“field”: “calc”, “type”: “quantitative”},
“theta”: {“field”: “calc”, “type”: “quantitative”},
“color”: {“value”: “black”}
}
}
],
“encoding”: {
“theta”: {
“field”: “calc”,
“type”: “quantitative”,
“stack”: “normalize”
},
“order”: {
“field”: “calc”,
“type”: “quantitative”,
“aggregate”: “sum”,
“sort”: “descending”
},
“color”: {
“legend”: {
“title”: “Medium (%)”,
“legendY”: -10,
“orient”: “right”,
“symbolSize”: 450,
“labelFontSize”: 25,
“titleFontSize”: 30
},
“field”: “Medium-Type”,
“type”: “nominal”,
“sort”: {“field”: “calc”, “order”: “descending”}
},
“opacity”: {“value”: 0.9}
},
“view”: {“stroke”: null}
}
Thanks admin