attached a pbix , an excel file with screenshots of what I will achieve
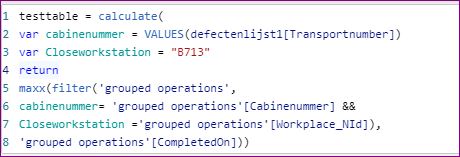
in some dax code I have hard code “B713”, can this be changed in a variable?
and can someone write the measure mentioned in the excel file
Hallo,
a lot of viewers but apparently no one with a solution.
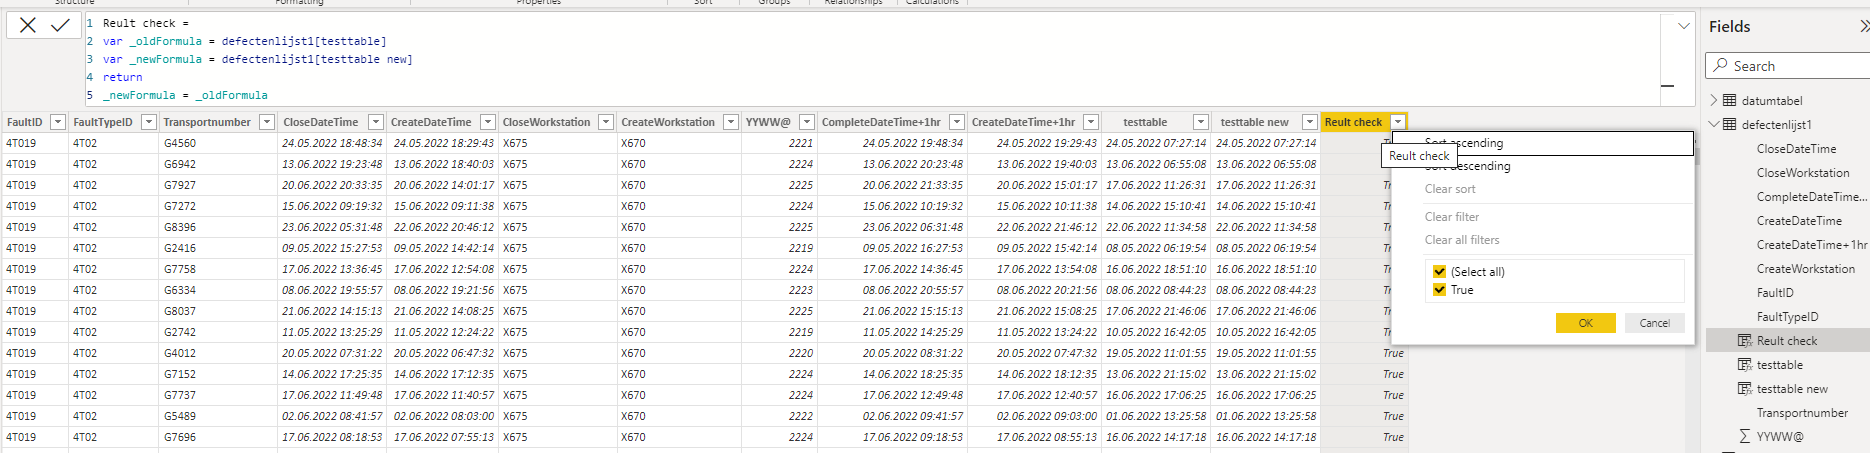
the question is simple, can I replace the " B713" on row 3 with a kind of
dax lookup from the table workstation. Filter the table the columns startpoint and area for “TRIMMING” and return the value of status = B713 ( column 1 )
the pbix is already available
To be honest I was trying to understand what you are trying to achieve but did not quite get it, I still do not understand what this data model is trying to do but if all you want to do is to get “Status” col value with this filter then you can use something like
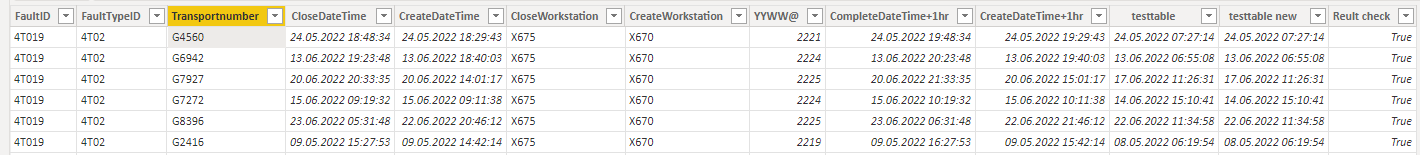
thanks for the reply, As you might see the screen shot is the result of a table with already a filter applied and just to show the value I want the dax to find. the whole table is +/-250 rows.
I want a formula to replace the hard code entry in the screenshot from the inital demand ( see row 3 var closeworkstation = "B713 ")
I need the datetimvalue for this workstation to compare it with other datetimevalues. ( described in the excel file comment on pbix.xlsx )
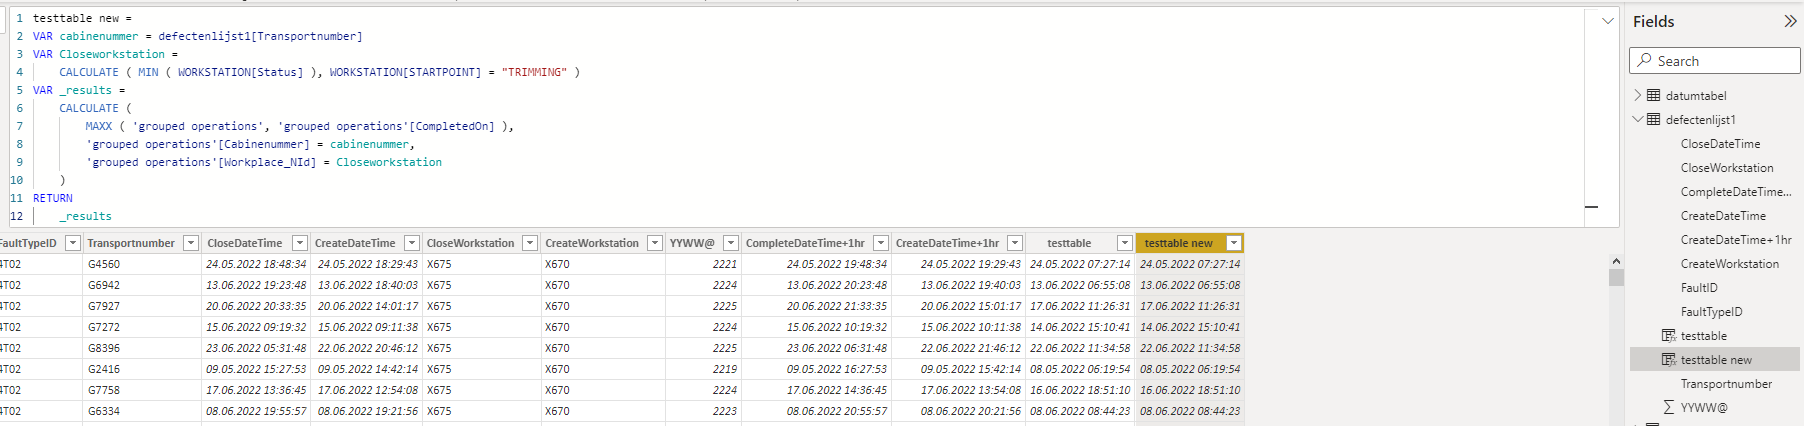
I have formatted and rearranged a little you testtable logic so it is more readable and easier to debug.
I also changed closeworkstation hardcode “B713” into formula
testtable new =
VAR cabinenummer = defectenlijst1[Transportnumber]
VAR Closeworkstation =
    CALCULATE ( MIN ( WORKSTATION[Status] ), WORKSTATION[STARTPOINT] = "TRIMMING" )
VAR _results =
    CALCULATE (
        MAXX ( 'grouped operations', 'grouped operations'[CompletedOn] ),
        'grouped operations'[Cabinenummer] = cabinenummer,
        'grouped operations'[Workplace_NId] = Closeworkstation
    )
RETURN
    _results
But the thing I do not understand is, why you want it to have a calculation for this?
Is it always “Trimming” for startpoint and it is always just 1 row returned?
Or perhaps to change it? and if after filtering there are several rows, how do you want to decide which one to chose?
But this measure that I have provided should meet your initial requirement
Piniusz
thanks for your reply and the measure.
" trimming" is just one calculation.
to start we created “Body”, “Lakstraat” and “Laktrim” , you can find these in the column startpoint from the workstation table.
I’m new to dax so I’m very pleased that you rearranged the logic of the measure. Now I can copy the measure and replace the “trimming” by “body”,… to create another measure.
Once again thanks for the help
now I can test the results to see if they fit the calculations made in Excel
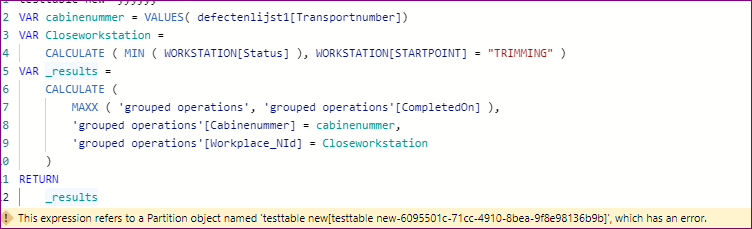
tried the dax code but it returns an error, I should expect a date/time value
de var cabinenummer must this be wrapped in a values() ?
do you have a result in the testtable new column?
kind regards
Roger
attached the pbix
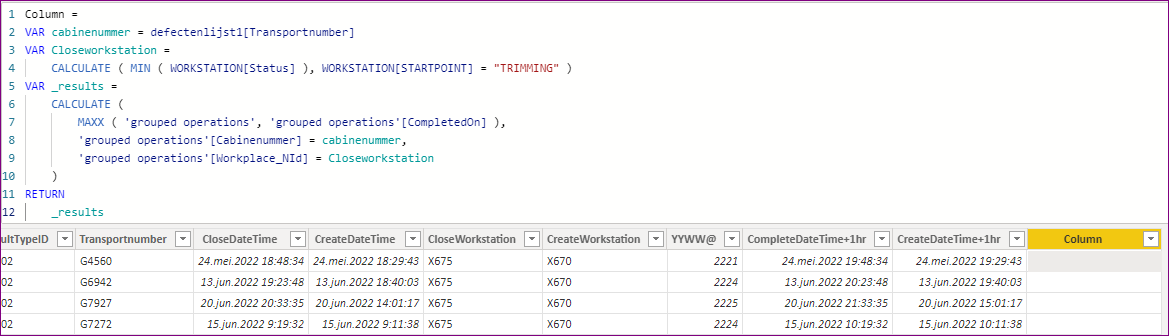
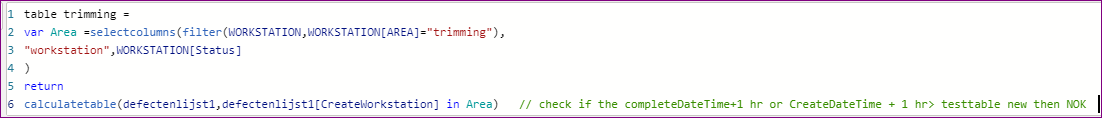
it’s the table trimming , I succeeded in getting the correct date now ( column testtable new)
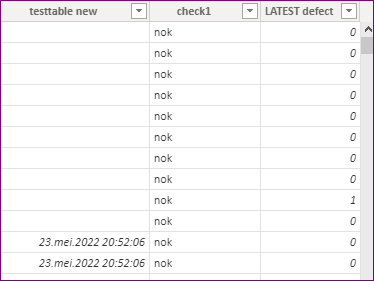
column check1 ( added comment //)
column latest defect (added comment //)
result " total defects" =
sum check1 eq uals nok and latestdefect=1 ( to count only 1 defect per transportnumber )
the table trimming serves just for checking the results and has to be replaced be a measure
can this be done?
I’m willing to pay for the solution desperate need this for a report
kind regards
Roger
The reason the dax stopped working for you is that you have added new table “Unieke workstation”, that wasa prefiltering worstation table to match transportnumber, so you ended with blank. This will fix that issue
And yes, you can have measure but you have to start from scratch and create proper data model first as that what you have are just some random tables floating around without any relationship
thank you very much for this solution and lesson in DAX,
you’re right about the proper dataset. The model exists with the datetable. but because of the size I extracted just a sample set.
One last question: the 3 checks " testtable new"; “check1” and “latest defect” I added in the table trimming will they be variables in the final
measure replacing the table trimming?
Learn DAX and understand well how sumx, minx etc. measures works then you can avoid adding a lot of those columns and do it for example in virtual table
Then you can do something like this (this is just a template)
Defects =
SUMX (
    ADDCOLUMNS (
        'table trimming',
        "_testable new", "logic from testtable new col",
        "_check1", "logic for check 1",
        "_latest defect", "logic for latest defect col"
    ),
    [_latest defect]
)
What that measure would do is the exact thing that you are doing in a table and then sum all you 1s from latest defect column for a given cross filter.
many thanks for your instructive advice, just new to dax I learned a lot,
I will use your template for my report.
are you a professional user of power BI ?
I tried to convert your template into a measure but I’m confused with the variables
line 2,3,4 creates the table trimming
when I use the addcolumns line 6 and add the first logic like your template i refer to the defectenlijst [transportnumber], how can I refer to the [ transportnumber] from the virtual table " tabelTrimming",
As you see the result is a empty table and I’m not sure what I’m doing wrong.
not able to sent the pbix ( to large )
kind regards
roger