Trends and totals

Oh wow am I having a good time with this.
I have
a trend measurem,
a sales measure
a financial period dimension

All is fantastic when you look at the chart or matrix

The issues start to arrive when you look at the trend differently i.e a total ( I know that does not make sense but it does not add up corrcetly) or I am trying to get the trend numbers for the next 6 months.

Either way this does not seem to be working

How do I get to sum a trend value?

Thanks
E

When I do my six months on the sales number it works

It is just the extra work to get the last six of the trend.

It is like I need to create a table first in the measure and then get the sum of the qualifying months. When I have tried this I cant sum them as it is not a base table

Calculation for the Trend Line Measure is below. The aim is to go from the last closed period back and calculate a linear trend line. This will show what hapopens in the futuire as well.

In addition I need to be able to provide a measure that calculates the trend from the current period to the end of the year.

The tremd line works in Matrix and chart but getting the sum of the values just does not work Placed the measure for the totals at the bottom.

Thanks
E

TrendLine =
//Simple linear regression =
// y = slope +b(intercept)

//Simple linear regression =
// y = slope +b(intercept)

VAR MonthsForTrend = 12
Var StartPeriod = -1 * (MonthsForTrend)

VAR Known =
FILTER (
SELECTCOLUMNS (
FILTER ( ALL(‘FYear’),‘FYear’[Fiscal Month offset] >= StartPeriod && ‘FYear’[Fiscal Month offset] <= -1
)
, “Known[X]”, ‘FYear’[Fiscal month offset]
, “Known[Y]”
, [Sales]
),
AND (
NOT ( ISBLANK ( Known[X] ) ),
NOT ( ISBLANK ( Known[Y] ) )
)
)

–==========================================
VAR Count_Items = COUNTROWS ( Known )
VAR Sum_X = SUMX ( Known, Known[X] )
VAR Sum_X2 = SUMX ( Known, Known[X] ^ 2 )
VAR Sum_Y = SUMX ( Known, Known[Y] )
VAR Sum_XY = SUMX ( Known, Known[X] * Known[Y] )
VAR Average_X = AVERAGEX ( Known, Known[X] )
VAR Average_Y = AVERAGEX ( Known, Known[Y] )

VAR Slope = DIVIDE ( Count_Items * Sum_XY - Sum_X * Sum_Y, Count_Items * Sum_X2 - Sum_X ^ 2 )
VAR Intercept = Average_Y - Slope * Average_X

RETURN

SUMX (
    DISTINCT ( 'FYear'[Fiscal Month offset] ),
    Intercept + (Slope * 'FYear'[Fiscal Month offset]) 
)

TrendLine YTG =
VAR ReturnValue = CALCULATE(
[TrendLine]
, REMOVEFILTERS(‘FYEAR’)
,‘FYEAR’[Month Offset >=0 && 'FiYEAR[Month Offset] <=6
)
Strewth,
TrendLine YTG =
VAR V0= CALCULATE(
[TrendLine]
, REMOVEFILTERS(‘FYEAR’)
,‘FYEAR’[Month Offset =0 )

VAR V0= CALCULATE(
[TrendLine]
, REMOVEFILTERS(‘FYEAR’)
,‘FYEAR’[Month Offset =1 )

VAR V11= CALCULATE(
[TrendLine]
, REMOVEFILTERS(‘FYEAR’)
,‘FYEAR’[Month Offset =0 )

Then just add the 11 together.
Got to be a better way
E

Hi @ells, we aim to consistently improve the topics being posted on the forum to help you in getting a strong solution faster. While waiting for a response, here are some tips so you can get the most out of the forum and other Enterprise DNA resources.

  • Use the forum search to discover if your query has been asked before by another member.
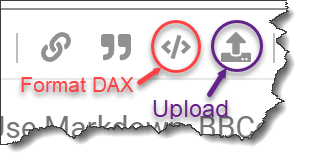
  • When posting a topic with formula make sure that it is correctly formatted to preformatted text </>.

image

  • Use the proper category that best describes your topic
  • Provide as much context to a question as possible.
  • Include the masked demo pbix file, images of the entire scenario you are dealing with, screenshot of the data model, details of how you want to visualize a result, and any other supporting links and details.

I also suggest that you check the forum guideline How To Use The Enterprise DNA Support Forum. Not adhering to it may sometimes cause delay in getting an answer.

Please also check the How To Mask Sensitive Data thread for some tips on how to mask your pbix file.