Hi All,
I now have a large dataset that gives me 1486 different indicators in 265 countries by row (e.g. 265 x 1486 rows) and in 63 years by column (63 columns).
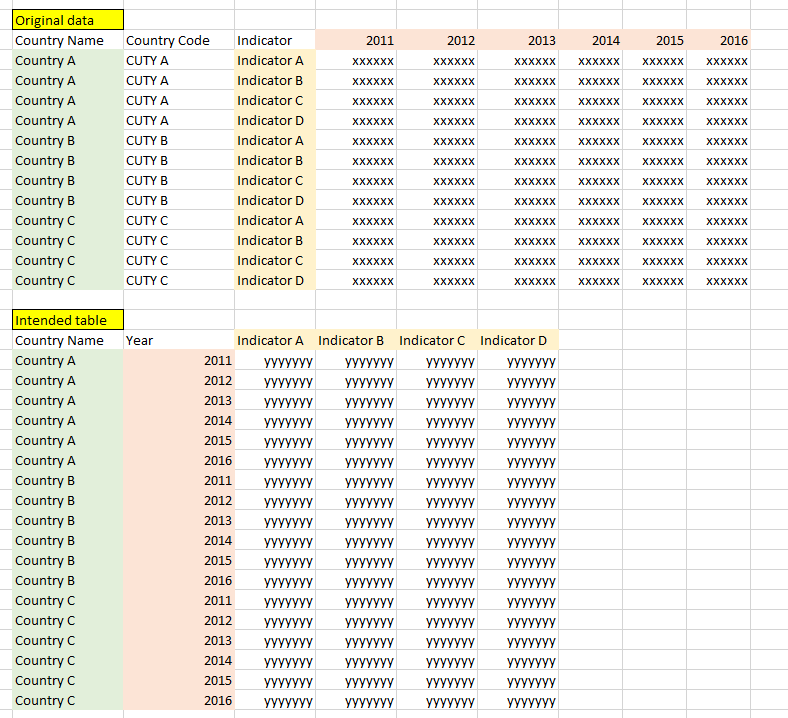
I am trying to transpose the 1486 indicators from rows to columns and 63 years from columns to rows while keeping the 265 countries. # of indicators within each country is fixed (1486) and # of years is fixed (63) for each country.
Much appreciated, if anyone can help me on this.
Many thanks in advance.
Data is here.
That’s pretty easy in Power Query. Just Unpivot the Years, then Pivot the Indicator. There are more complex ways to do this without relying on Column Names, as they will likely change, but Unpiviot and then Pivot is the quickest why to do it.
1 Like
Answer
This would be the Power Query Code Created
let
    Source = Excel.CurrentWorkbook(){[Name="Table1"]}[Content],
    #"Changed Type" = Table.TransformColumnTypes(Source,{{"Country Name", type text}, {"Country Code", type text}, {"Indicator", type text}, {"2011", Int64.Type}, {"2012", Int64.Type}, {"2013", Int64.Type}, {"2014", Int64.Type}}),
    #"Unpivoted Columns" = Table.UnpivotOtherColumns(#"Changed Type", {"Country Name", "Country Code", "Indicator"}, "Attribute", "Value"),
    #"Pivoted Column" = Table.Pivot(#"Unpivoted Columns", List.Distinct(#"Unpivoted Columns"[Indicator]), "Indicator", "Value", List.Sum)
in
    #"Pivoted Column"
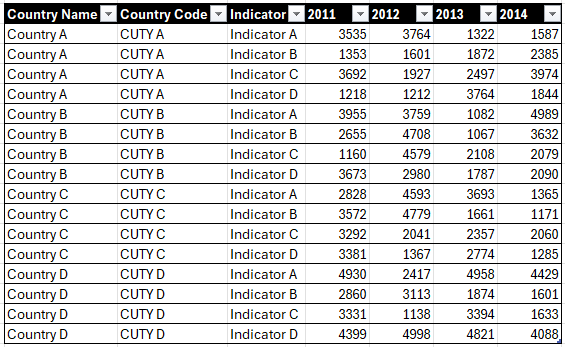
Source Table
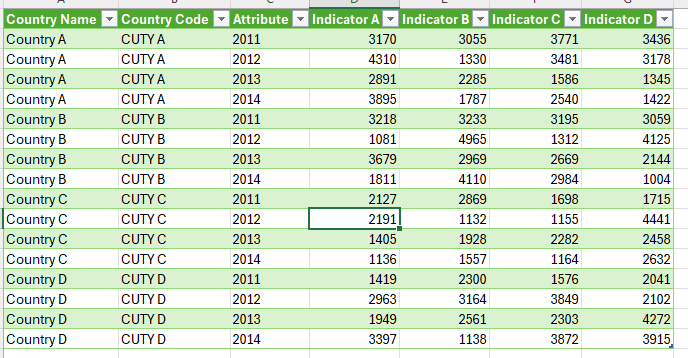
Output Table
1 Like
Thank you very much. Neville. Will explore more with the Pivot and unPivot function