I hope that you are all well and safe during this pandemic.
I have modeled a sensitivity analysis on Power BI and i created a measure to forecast prices based on units sold.
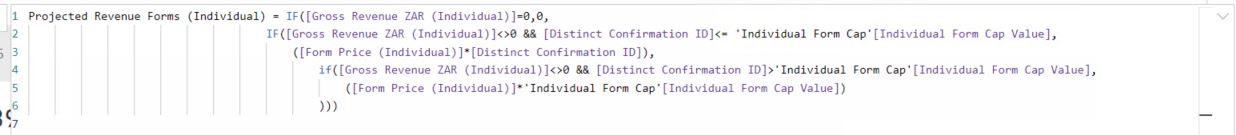
I created what if parameters in my model, and then wrote a nested if statement based on the parameters to try forecast projected revenue. Please see attached snippet of my measure.
The data set i am working on is quite big, and the measure seems to calculating correctly and providing me with the desired output. Instead of providing a column total, the measure works on a row context and applies the measure to the other column totals.
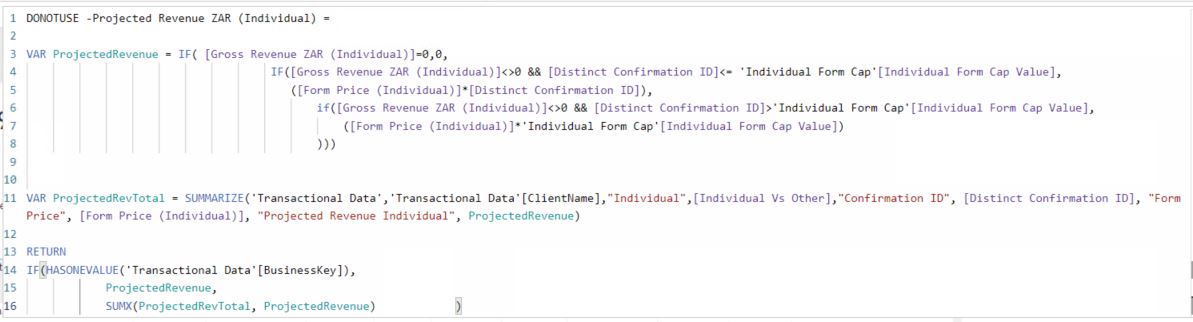
I tried creating another measure to run the Total, but it grossly inflates the total. Please see attached Total Measure i wrote.
Welcome to the forum @Craigarb. To receive a resolution in a timely manner please make sure that you provide all the necessary details on this thread.
Here is a potential list of additional information to include in this thread; demo pbix file, images of the entire scenario you are dealing with, screenshot of the data model, details of how you want to visualize a result, and any other supporting links and details.
Including all of the above will likely enable a quick solution to your question.
Thank you for sending this through.
I tried the solution and it seemed to work in a few cases.
When creating the summary table, the video adds a single column since that is what the original table has. My table has about 7 columns, so should i also create 7 columns in the virtual table or with the main columns only?
Hi,
“Seemed” is not good enough . It either works or is the wrong solution.
Concerning your question about columns, always hard to answer without a pbix but you want to show the total for 7 columns = 7 calculations = 7 measures.
Paul
 . It either works or is the wrong solution.