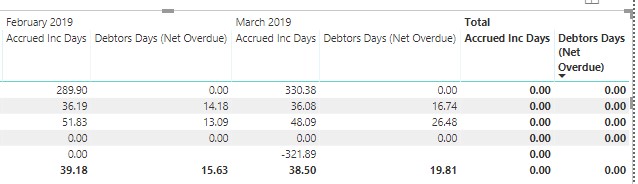
I have created a debtors and accrued income days measure as per the below
Debtors Days (Net Overdue) = IFERROR(([Debt Net Overdue]/([Income LQ]*4))*365,0)
Accrued Inc Days = IFERROR(([Accrued Income]/([Income LQ]*4))*365,0)

Debt Net Overdue = CALCULATE([Debt Net],filter('Debt','Debt'[Days Overdue]>=0))
Accrued Income =
VAR ACCY = CALCULATE(sum('Acc Y WIP'[Amount in local currency]),
                FILTER('Acc Y WIP',
                    ('Acc Y WIP'[G/L Account] = 418100) ||
                    ('Acc Y WIP'[G/L Account] = 418400) ||
                    ('Acc Y WIP'[G/L Account] = 418450)))
return
ACCY
However since I changed the income calculation to be the annual value of the last quarter as per the below
Income LQ = //Last Quaters Income
CALCULATE (
    SUM ( 'P&L'[Actual in LC] ),
    DATESINPERIOD ( 'Date'[Date], MAX ( 'Date'[Date] ), -3, MONTH ))
It will not show a total value in the table visualisation that I have set up in Powerbi. Could you advise how I could resolve this