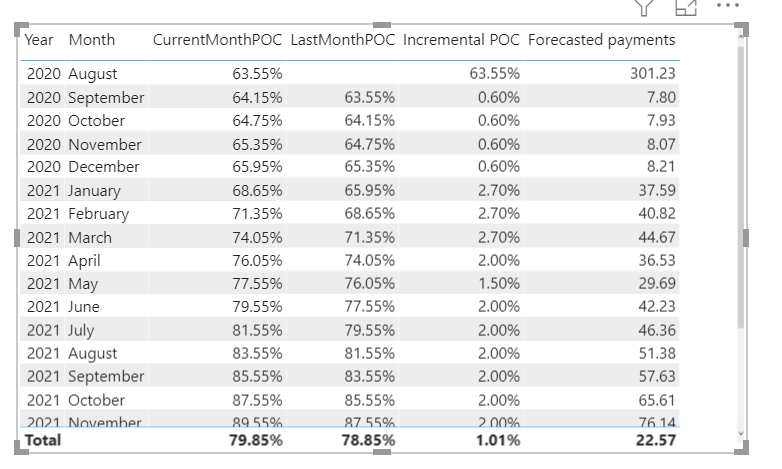
I have attached the pbi file, where for Forecasted Payment measure, at the row level values are correct, but for the total value is wrong.
I know it is a common problem, and can be solved using HASONEVALUE(‘Date’[Date].[Month]) and then creating two seperate formulas for total and row level calculations. However , I am not able to get the total calculation right.
Also i want to see only the current month and future dates in my table. In the current table (PBix attached), I am able to see Values for September only if I display August, but I only want September(current month) and future.
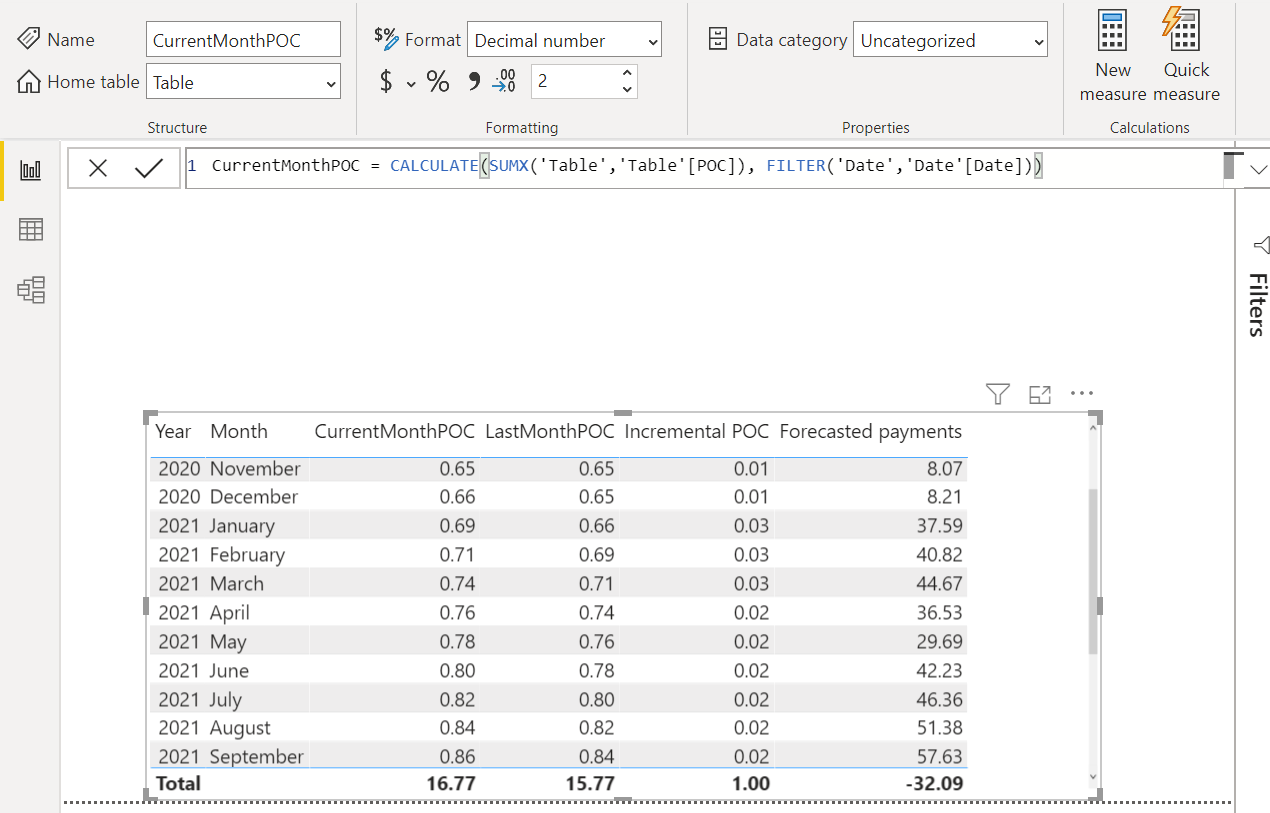
You should not use SUM when trying to calculate the %, Try using below formula which I modified for CurrentMonthPOC and LastMonthPOC. You can now adjust other measures accordingly.
I see where it went wrong, you are trying to calculate percentage and then subtracting those current with lastmonth so it will not give the correct result. Please change the AVERAGEX with SUMX and change the format of all to decimal unless you want to display that too as %(let me know). You will have correct result.
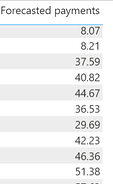
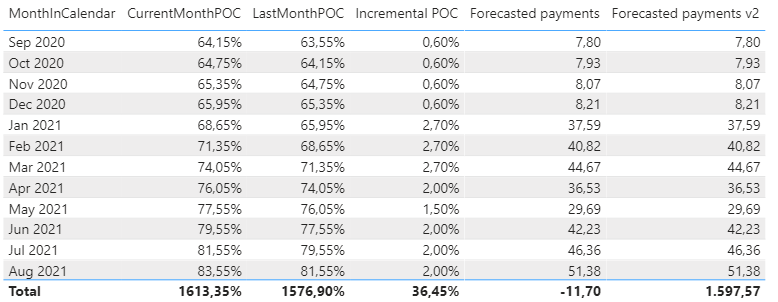
Total for Forecasted Payments should be 8.07+8.21+37.59+40.82+44.67+…(in the above picture)
But now its Total Increment /(1- Total Last Month)*474
ie. 1.00/(1-15.77) * 474
which is not the expected
May be I didn’t understood the question correctly, sorry for the inconvenience. Will leave for other forum members to answer. Also you can check below which might help you.
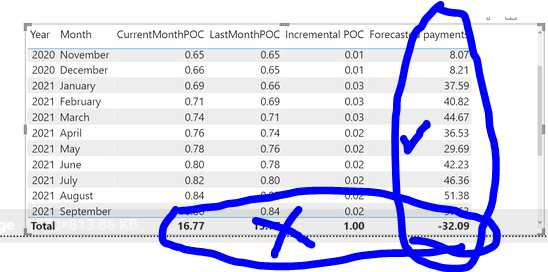
Here in my case Forecasted Payments values Row-wise is correct, But just the total is incorrect because it is calculating Total Increment /(1- Total Last Month )*474
ie. 1.00/(1-15.77) * 474 = -32.09 which is incorrect.
Whereas the correct should be sum of all these,
I know it can be implemented using two measures, one when HASONEVALUE(‘Date’[Date].[Month]) is TRUE, and the measure evaluates at row level,
another for total itself when HASONEVALUE(‘Date’[Date].[Month]) is FALSE
Also i want to see only the current month and future dates in my table. In the current table (PBix attached), I am able to see Values for September only if I display August, but I only want September(current month) and future.
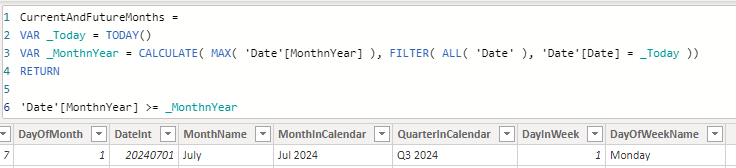
Next created some logic in a Calculated Column (you can also do this same in PQ M of course)
This allows us to easily Filter the Date table on Current and Future months alone.
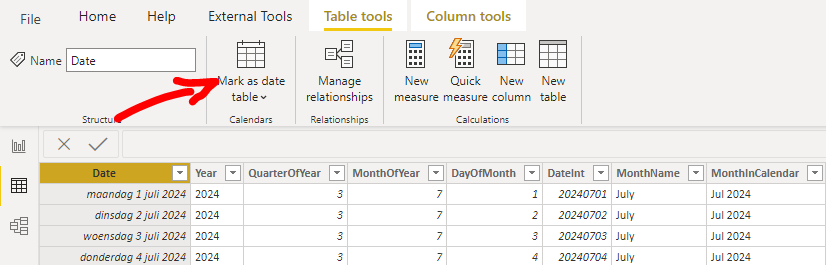
#1 - in order for any Power BI time intelligence to work, your date table must be marked as such. I’ve only taken a quick look at this thread, and it doesn’t look like you’re using time intelligence in it, but to allow for the possibility in different visuals, please do; it’s also a best practice. I do this as the first step in all my reports/models. Greg
That is correct you can only use iterators in combination with virtual tables.
There is a concept in DAX called “Syntax Sugar”. Simply put, the developers have created simplified versions of more complex formulas to make it easier to learn and use DAX but those can’t be used with virtual tables. Here are some examples.
Syntax Sugar for Total Sales = SUM(Sales[ExtendedAmount])
Full Syntax for Total Sales = SUMX(Sales, Sales[ExtendedAmount])
You can read more on that here:
And I think Brian Grant from CSG found a simple way of visually explaining what DAX is doing
eDNA - ch (1).pbix (126.9 KB)
When we mark as date table won’t default date hierarchy come?
When using date hierarchy created, I am unable to sort in month order.