I want to take all the values from the weeks prior to the current week and add to the current week.
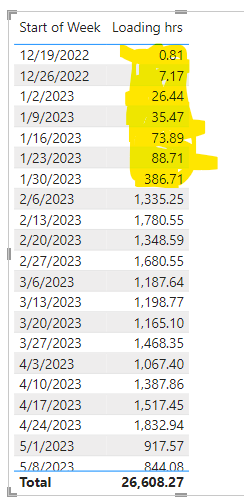
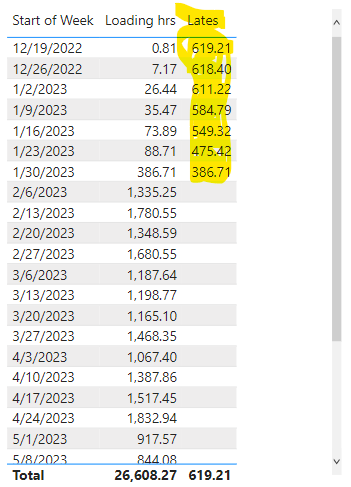
The image below shows values from 12/19/22 thru 1/30/2023 (incidentally the dates shown are start of each week in our case which is a Monday and we run on a fiscal calendar July 1st thru June 30th).
The total value for the weeks prior to the current week (current week is 2/6/2023) is 619.21, this is essentially late product and now need to show it as “Lates” in the current weeks loading.
I tried using DATESBETWEEN but struggled getting the correct results.
Lates =
VAR _CurrentWeek = TODAY() - WEEKDAY( TODAY() , 2 )
VAR _PriorWeeks = MIN ( 'Date'[Start of Week] )
VAR _Lates =
CALCULATE(
    [Loading hrs],
DATESBETWEEN(
    'Date'[Start of Week] ,
    _PriorWeeks ,
    _CurrentWeek
    )
)
RETURN
_Lates
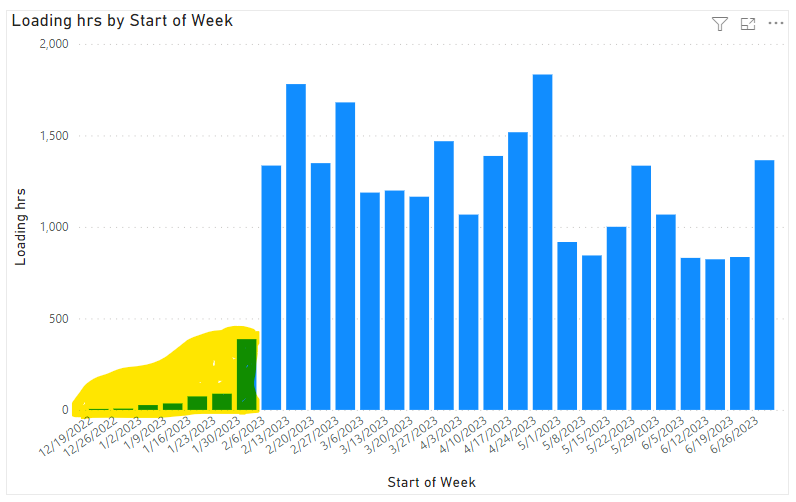
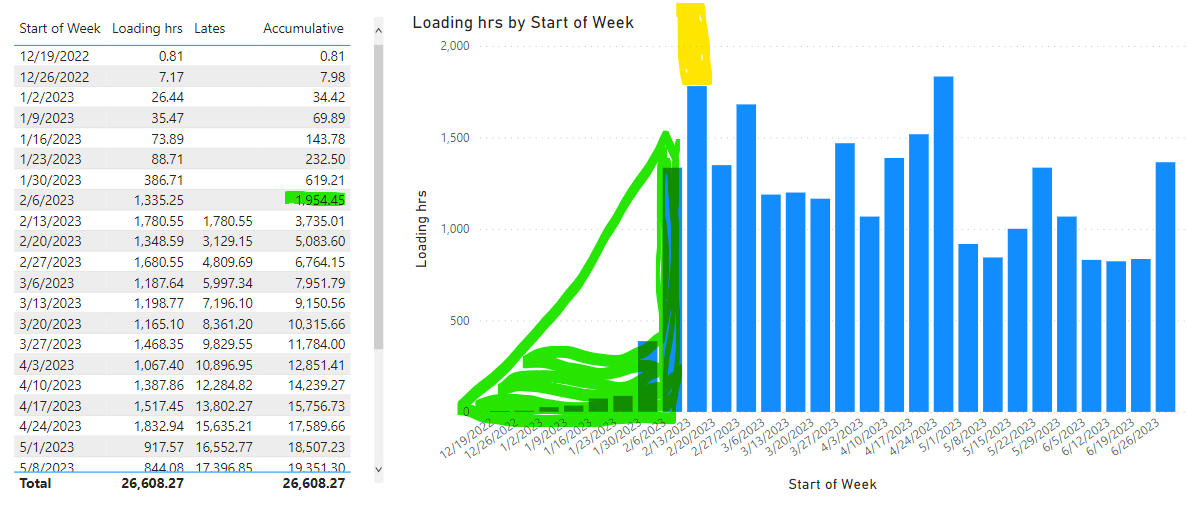
The next issue would then be the charting, the image below shows a simple chart where the loading values are charted against the start of each week. Ideally we don’t want to see the previous weeks in the chart, only current week and weeks in the future.
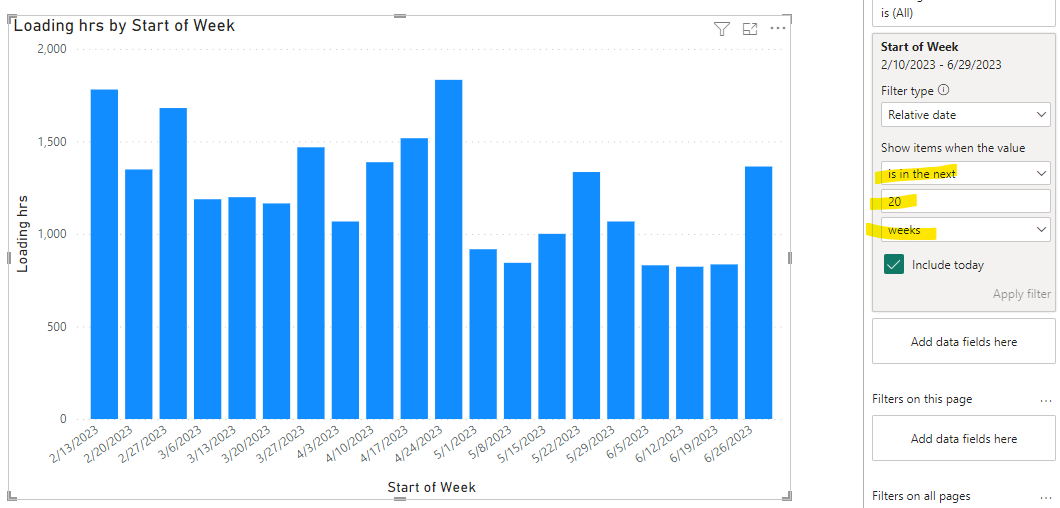
Using the Relative Date filter against the X-Axis where we select “is in the next” 20 “weeks”, results in loosing the current week, therefore not a good solution, it would appear the I need a measure that captures the current week and weeks in the future then apply this against the X-Axis.
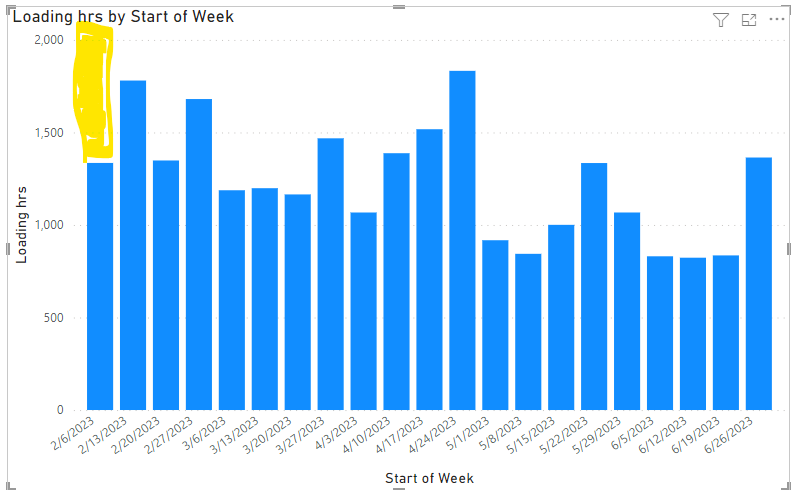
The chart should look this below, with the “Lates” shown as a separate bar on top of the current week.
Any help would be greatly appreciated.
JR
Test Rev-1.pbix (250.0 KB)
Bumping this post for more visibility from our experts and users.
Hi @jprlimey ,
Due to inactivity, we’d like to conclude that your inquiry was out of the expert’s and users’ bounds.
If you were sure you** provided all pertinent context to your concerns and read how to use the forum more effectively **and still find your question unanswered, your membership also comes with relevant resources that may help you with your Power BI education, so we advise that you check these resources as well.
We’re happy to help you with your query. However, we hope that you’ll be patient as this isn’t an on-demand forum. Response times will likely be anywhere between 12-48 hours.
Our users and experts will do as much as reasonable to help, but if there is some learning to be done, you may be directed to relevant tutorials to learn this yourself rather than having answers continuously delivered to you. This is indicated inthe how-to guide on using the forum- How To Use The Enterprise DNA Support Forum
Thank you for bumping the post, hopefully we can someone to assist.
I think our best approach would be to attempt to simplify this request. The image below shows the loading by week (start of week which is Monday) As you can see if the current week is 2/13/2023 then any activity prior to this date is technically late production. The Accumulative measure shows 1954.45 on date 2/6/2023, this is the total hours that are late. What we need to do is add the 1945.45 to the current weeks loading (2/13/2023 of 1780.55)., this would total 3726. The trick is then to show the “lates” as a separate bar in the chart, however the x-axis needs adjusting to show only the current week and weeks in the future.
Below is an updated Power BI file also
Thanks
JR
Test Rev-1.pbix (250.4 KB)
I did the following to get the start of the week based on today.
Current Week = TODAY() - WEEKDAY( TODAY() , 2 )
I then changed chart X-Axis to Continuous then add the Current Week measure to the Min Axis value.
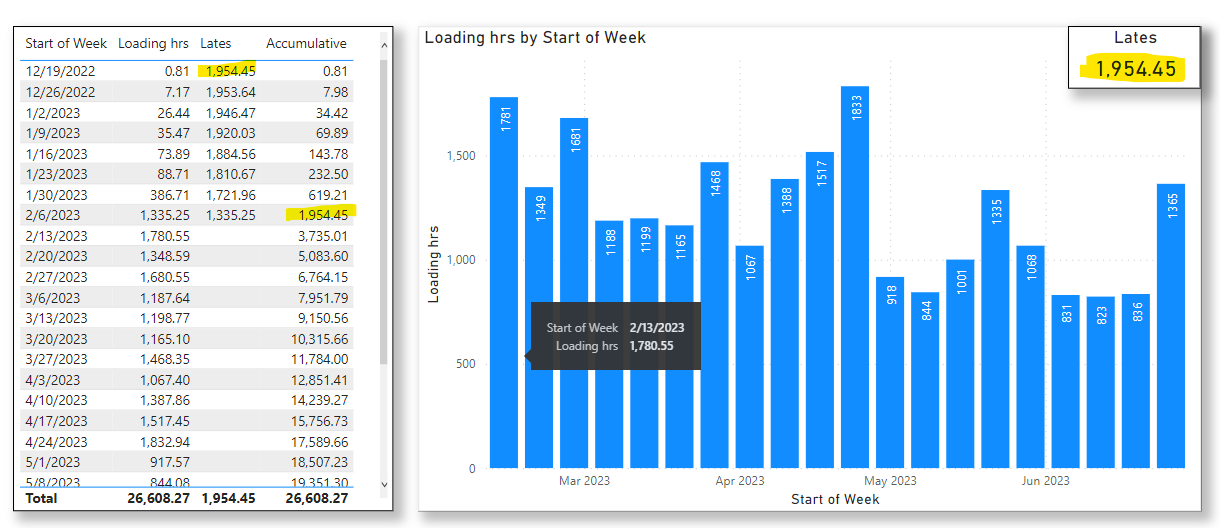
This then removed all prior weeks from the chart as shown below. I then created a Card visual with the following measure
Lates =
VAR _CurrentWeek = TODAY() - WEEKDAY( TODAY() , 2 )
VAR _PriorWeeks = MIN ( 'Date'[Start of Week] )
VAR _Lates =
CALCULATE(
    [Loading hrs],
DATESBETWEEN(
    'Date'[Start of Week] ,
    _PriorWeeks ,
    _CurrentWeek
    )
)
RETURN
_Lates
The Lates result is correct at 1954.45
This isn’t the most elegant of solutions but practically it provides the correct result by using the card visual. Both the first value of the Lates measure does match the Accumulative measure (yellow highlights), which gives me confidence we have the correct value for Lates. Would have been nice to show the Lates as a bar on top of the current week but it’s probably not doable.
Lastly, the X-Axis as Continuous only shows as Month Year, rather than the Start of Week (shown as a full date) when using Categorical, I guess this is the trade-off to using an actual measure for Min X-Axis when in Continuous option.
As nobody has responded to this topic to-date, I’ll say it is solved, but not the prettiest of solutions.
JR