Hi there!
Is anyone aware whether we can change or if there’s any option to modify Tornado visual font type?
As depicted in the screenshot, by using Tornado visual I end up having my Categories in a different font type vs the rest of my report, which is quite annoying.
If this is something we can’t do, would any of you the Tornado font type so I can keep the rest of my report sticking to the very same format - though not my preferred option.
Thanks a lot
1 Like
Hi @SamSPAIN,
I have been testing the Tornado custom visual and as you mentioned, it is not possible to change the font type of the Group section.
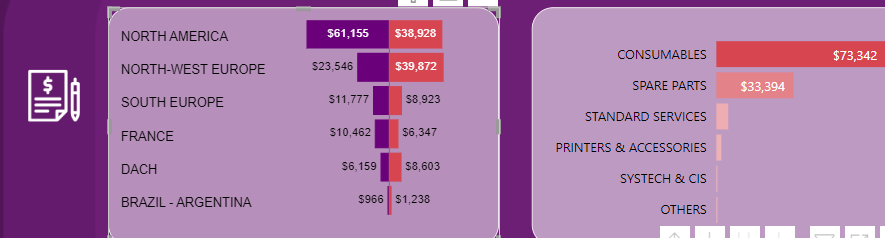
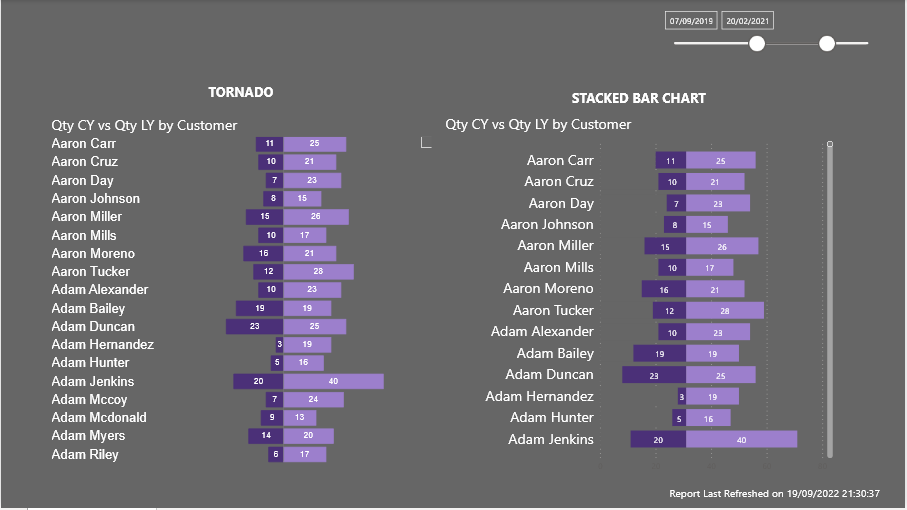
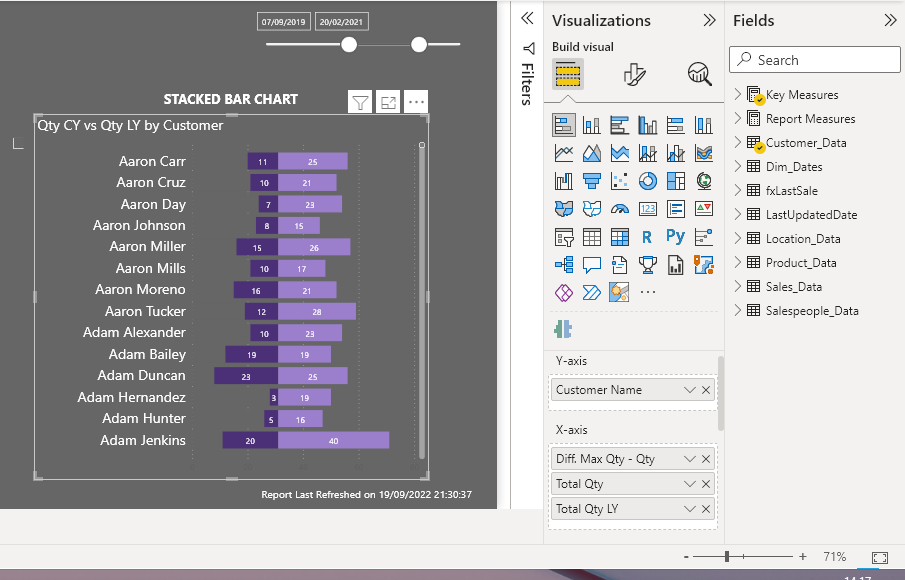
I have been trying to replicate this visual from a native object like the Stacked Bar Chart and this is the result.
In this example I show the amount sold in the current year and the amount sold in the previous year by Customer. To center the axis, I have added a measure on the left with the difference between the maximum amount sold this year and the current amount.
In this measure we paint the bar with the same color as the background and we remove the data label.
Hope this possible solution can help you.
Regards,
Tornado_Visual_JAFP.pbix (1.1 MB)
2 Likes
Thanks a lot, awesome @jafernandezpuga !
Your approach is terrific as long as you are working with 1 Core Measure, in your case it’s the [Total Qty] which comes from the same factual table.
In my case, I need to work with 2 different formulas, each pointing to its specific fact table. These are [B2B Sales] and [B2B Target].
Since both point to Geo_Mapping, I did try replicate your logic creating 2 Max on for Sales another one for Target but I’m uncapable to make it work.
Find attached a sample PBIX in case you might want to give it a go 
Tornado 2 measures.pbix (27.9 MB)
Muchísimas gracias Jose Antonio
1 Like
Hi @SamSPAIN,
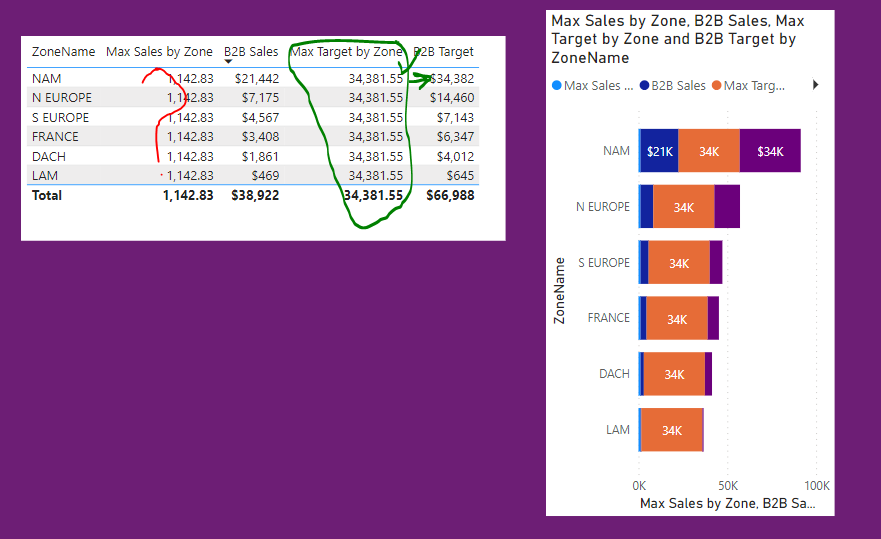
I have reviewed the example you have shared and to recreate the Tornado visual with a Stacket Bar Chart I have created the following measure that works when we display the information in a hierarchy.
Diff B2B Sales with Max Value =

VAR _SalesB2B = [B2B Sales]

VAR _Max_Sales_by_ZoneName = MAXX(

    ADDCOLUMNS(

        ALLSELECTED( Geo_Mapping[ZoneName] ),

        "@Sales", [B2B Sales]

    ),

    [@Sales]

)

VAR _Max_Sales_by_ZoneName_And_Comm_Op = CALCULATE(

    MAXX(

        ADDCOLUMNS(

            ALLSELECTED( Geo_Mapping[ZoneName] ),

            "@Sales", [B2B Sales]

        ),

        [@Sales]

    ),

    REMOVEFILTERS( Geo_Mapping[Comm Op] )

)

VAR _Max_Sales_by_Comm_Op = MAXX(

    ADDCOLUMNS(

        ALLSELECTED( Geo_Mapping[Comm Op] ),

        "@Sales", [B2B Sales]

    ),

    [@Sales]

)

VAR _Result = SWITCH(

    TRUE(),

    ISINSCOPE( Geo_Mapping[Comm Op] ) &&

    NOT ISINSCOPE( Geo_Mapping[ZoneName] ),

    _Max_Sales_by_Comm_Op - _SalesB2B,

    ISINSCOPE( Geo_Mapping[Comm Op] ) &&

    ISINSCOPE( Geo_Mapping[ZoneName] ),

    _Max_Sales_by_ZoneName_And_Comm_Op - _SalesB2B,

    ISINSCOPE( Geo_Mapping[ZoneName] ),

    _Max_Sales_by_ZoneName - _SalesB2B

)

RETURN

_Result
This measure is the one that we add to the left of the graph so that the axis is centered and the one that we hide.
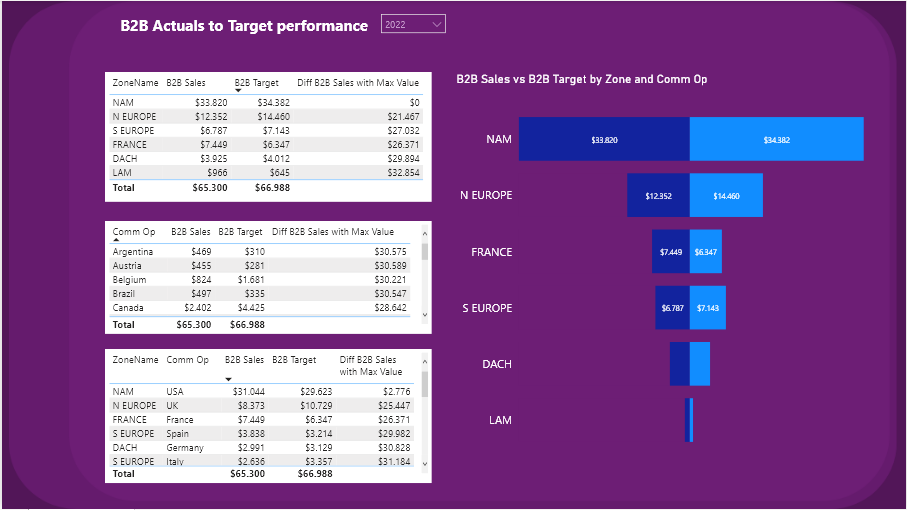
By Zone:
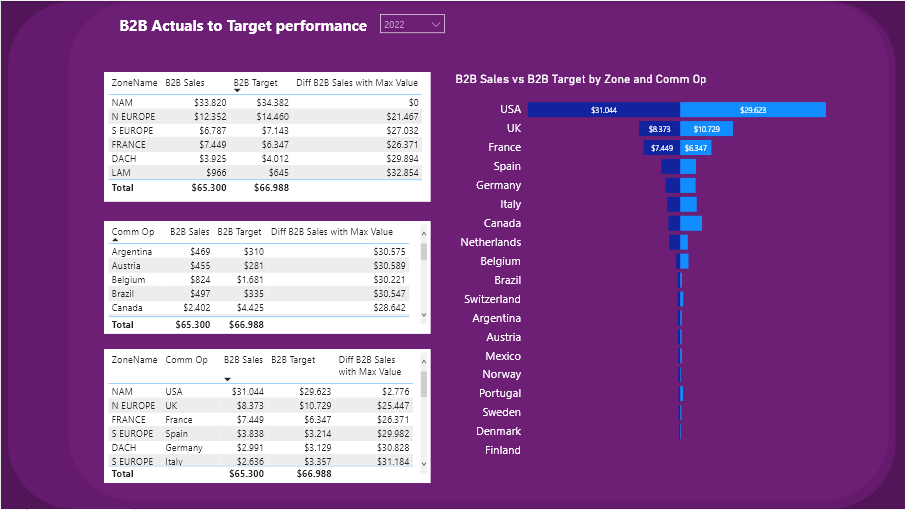
By Comm Op:
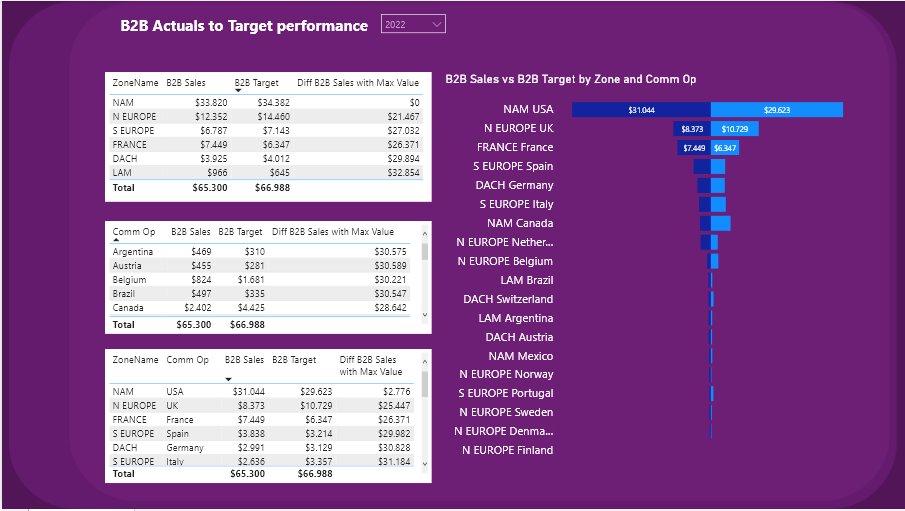
By Zone and Comm Op:
Regards,
Tornado 2 measures_JAFP.pbix (27.9 MB)
2 Likes
Astonishing @jafernandezpuga!
Haven’t seen anyone on the Internet capable to replicate the tornado as you did. Kudos to you!
I must admit the piece of code you came up with is well above my level - will try debug each piece of code to master your unique technique
Mil gracias por compartir tu conocimiento
2 Likes
Hi @SamSpain,
Thank you very much Samuel and glad to have been able to help you.
Regards
2 Likes
Good morning @SamSPAIN,
I have been testing the solution that I proposed and for the case in which we show the information in the hierarchy, I have modified the measure that we created because the calculation of the maximum in this case was not entirely correct.
Diff B2B Sales with Max Value =

VAR _SalesB2B = [B2B Sales]

VAR _Max_Sales_by_ZoneName = MAXX(

    ADDCOLUMNS(

        ALLSELECTED( Geo_Mapping[ZoneName] ),

        "@Sales", [B2B Sales]

    ),

    [@Sales]

)

VAR _Max_Sales_by_ZoneName_And_Comm_Op = MAXX(

        ADDCOLUMNS(

            CROSSJOIN(

            ALLSELECTED( Geo_Mapping[ZoneName] ),

            ALLSELECTED( Geo_Mapping[Comm Op] ) ),

            "@Sales", [B2B Sales]

        ),

        [@Sales]

    )


VAR _Max_Sales_by_Comm_Op = MAXX(

    ADDCOLUMNS(

        ALLSELECTED( Geo_Mapping[Comm Op] ),

        "@Sales", [B2B Sales]

    ),

    [@Sales]

)

VAR _Result = SWITCH(

    TRUE(),

    ISINSCOPE( Geo_Mapping[Comm Op] ) &&

    NOT ISINSCOPE( Geo_Mapping[ZoneName] ),

    _Max_Sales_by_Comm_Op - _SalesB2B,

    ISINSCOPE( Geo_Mapping[Comm Op] ) &&

    ISINSCOPE( Geo_Mapping[ZoneName] ),

    _Max_Sales_by_ZoneName_And_Comm_Op - _SalesB2B,

    ISINSCOPE( Geo_Mapping[ZoneName] ),

    _Max_Sales_by_ZoneName - _SalesB2B

)

RETURN

_Result
Regards
Tornado 2 measures_JAFP.pbix (27.9 MB)
1 Like
Thanks a lot @jafernandezpuga ! I will test it and compare the differences between the 2.
1 Like