Hi there clever people!
I have a ranking situation that I am trying to solve and have approached it from 5 different ways and reach the same result every time, so I may be about to go insane. Hopefully, someone can help!
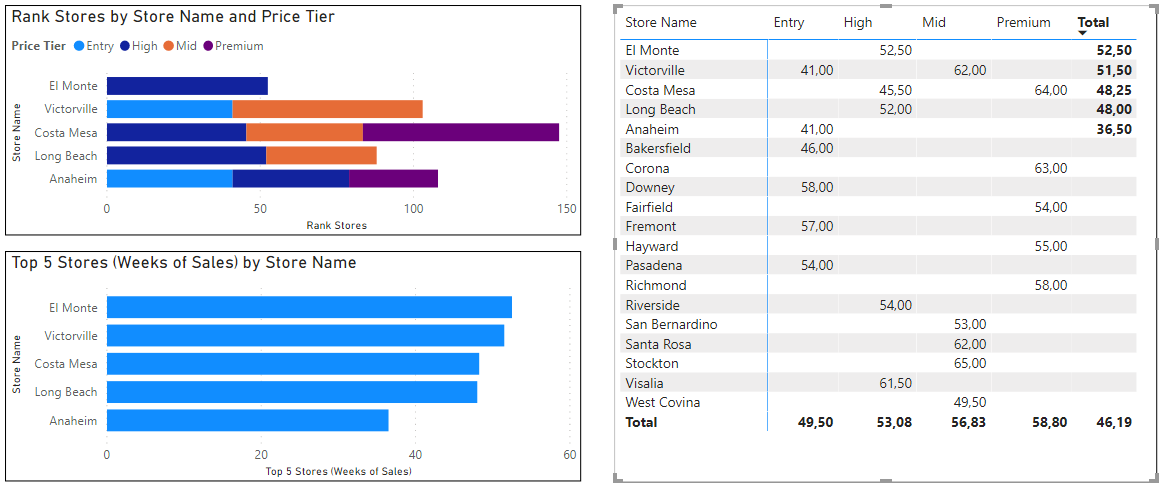
I am trying to Rank the Top 5 retail stores by WOS (weeks of Supply) using TopN (but I have tried Rankx as well without success) that is a simple calculation of average stock on hand divided by the average sales over the past 4-weeks.
The initial ranking works well (I can see the top 5 stores) but it falls apart when I bring in a second dimension.
I need to see the weeks of supply for these top 5 stores with the associated product price tier, however, as soon as I add the price tier to the visual I get other stores too because it pulls in the top 5 price tiers.
The model can be found here: https://drive.google.com/file/d/1vnNplHUeSV2o19D08bFDou6EBoPNxyjO/view?usp=sharing
Please let me know if you need more information to help.
Many thanks
Phil