TopN on a Crossjoin

Good day,

I have a problem, that would be appreciated if you could help me to sort out.

I done a mock up example that I attach here the Xls and PBI file for reference

I would like to pick the Top N on a selection made on a Crossjoint, and few other minor issues.

Here below the detail.

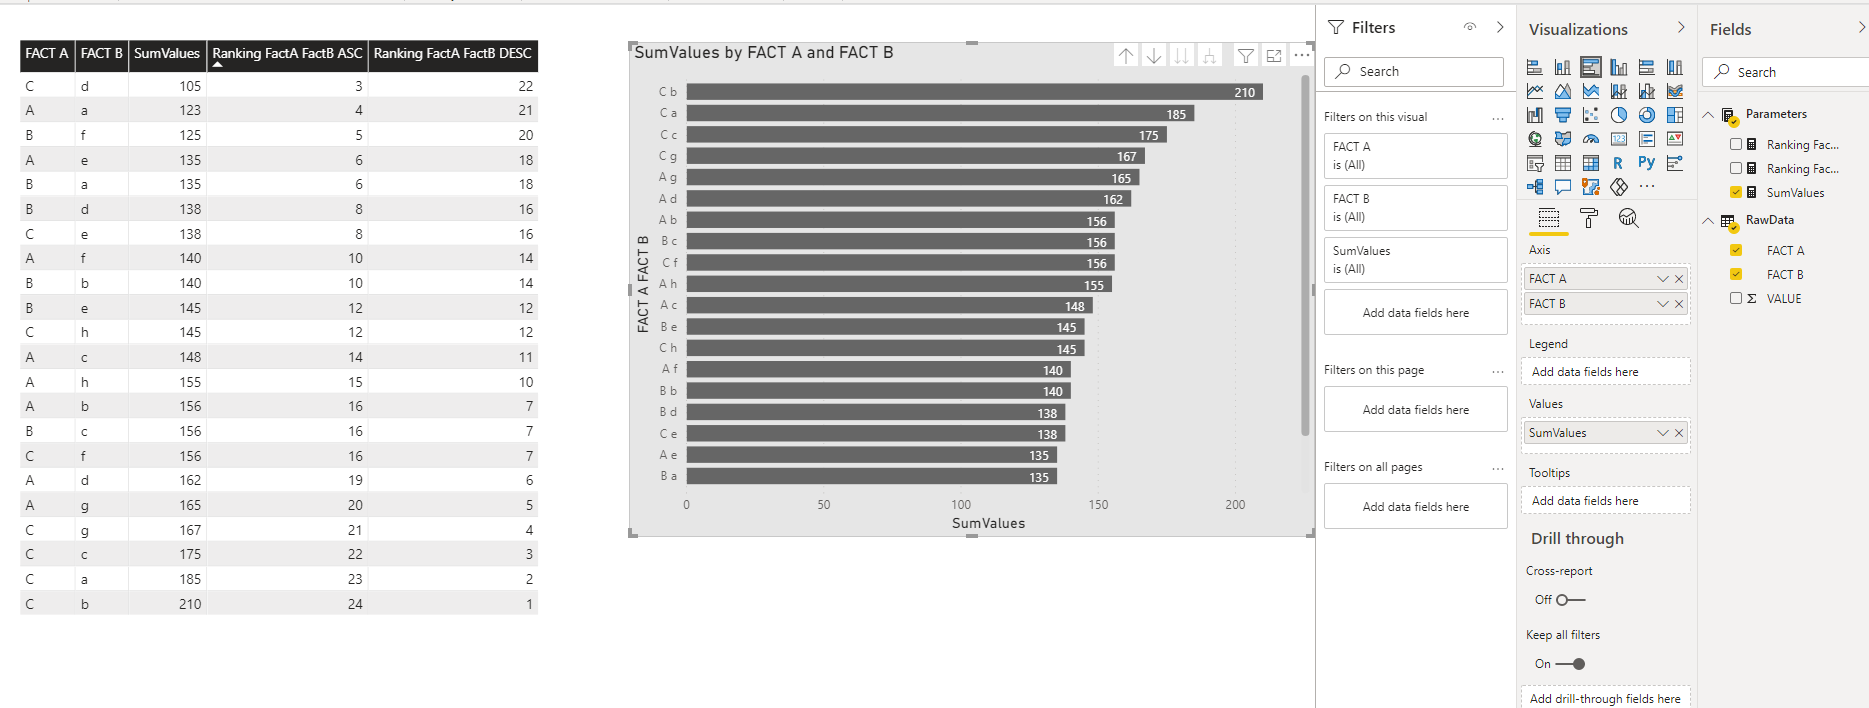
The table, see the figure below has 3 columns (Fact A, Fact B, Value).

Ranking Issue

In Power BI I prepare two visualization a table with Fact A, Fact B, the Sum of values and the relative descending and ascending ranking, using the parameters:

Ranking FactA FactB ASC =

RANKX(

CROSSJOIN( ALL( RawData[FACT A] ), ALL( RawData[FACT B]) ) ,

[SumValues], , ASC

)

Ranking FactA FactB DESC =

RANKX(

CROSSJOIN( ALL( RawData[FACT A] ), ALL( RawData[FACT B]) ) ,

[SumValues], , DESC

)

Where

SumValues = SUM (RawData[VALUE] )

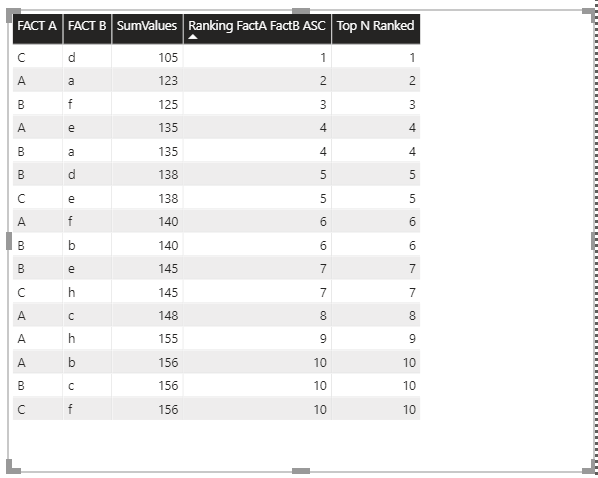
So far so good, as per snapshot I got the ranking, correct for the Descending option while the ascending for the lowest value (highest for descending) rank as 3 instead of 1. See Snapshot

TopN on Crossjoin

Now let arrive to the point I am stuck with.

As per the previous table and the histogram below I graphed the combination of Fact A and Fact B in ascending or descending order, but I would like to show only the Top 5.
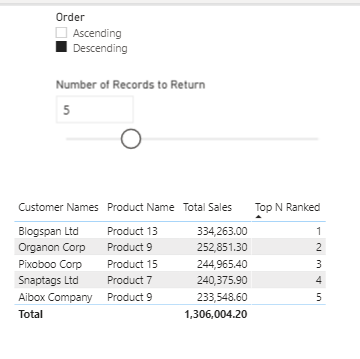
I know I should use the DAX function TOPN, but how when should work on a Crossjoin sub data set?

Looking forward for your support.

Regards,
Luca

RAW DATA TABLE: TopOnCrossjoin-RawData.xlsx (10.0 KB)

PARAMETERS:

Ranking FactA FactB ASC =

RANKX(

CROSSJOIN( ALL( RawData[FACT A] ), ALL( RawData[FACT B]) ) ,

[SumValues], , ASC

)

Ranking FactA FactB DESC=

RANKX(

CROSSJOIN( ALL( RawData[FACT A] ), ALL( RawData[FACT B]) ) ,

[SumValues], , DESC

)

Where

SumValues = SUM (RawData[VALUE] )

TABLE & HISTOGRAM VISUALIZATION:

Happy to help you with this one, but unfortunately the PBIX file did not come through. Can you please repost?

Thanks.

  • Brian

@LucaB72,

TOPN isn’t what I would use here, because that function returns a table, not a scalar. Instead, I would return only the desired N records based on the RANKX results on the CROSSJOIN table. Here’s how I implemented that, making both the sort order and the N records returned dynamic, using an example I created from the Practice Dataset External Tool:

Top N Ranked =

VAR Result =
    SWITCH (
        TRUE (),
        [Harvest Asc Desc] = "DESC",
            IF (
                [RankSales Desc] <= [Number of Records to Return Value],
                [RankSales Desc],
                BLANK ()
            ),
        IF (
            [RankSales Asc] <= [Number of Records to Return Value],
            [RankSales Asc],
            BLANK ()
        )
    )
RETURN
    IF ( HASONEVALUE ( Customers[Customer Names] ), Result, BLANK () )

And here’s what it looks like put together:

image

I hope this is helpful. Full solution file attached.

– Brian
eDNA Forum – Crossjoin Top N Solution.pbix (410.1 KB)

2 Likes

Thanks,
great solution to get the TopN applying the visual filter.
I was trying to make it using the TopN function but get stuck on the first parameter due to the crossjoin

Attached the PBIX of the original post, sorry I forgot to attach at first.
TopN on Crossjoin.pbix (27.0 KB)

luca

Hi Brian
applied yoru solution, using an hard coded N value of 10 and does work, also on charts.

Thanks for the solution.

I attaeched the PBIX for reference, if needed to others, but your file is the key.
TopN on Crossjoin-AsShown.pbix (28.1 KB)

Does remain the issue with the ranking numbering for Ascending that reach 3 and not 1.

Thanks for your support, appreciated
Luca

@LucaB72,

I’ll keep working on this. I’ve got ASC now ranking up to 2, but it’s still picking up a blank somewhere that is interfering with the #1 ranking. Hopefully have a solution back to you later this afternoon.

  • Brian

@LucaB72,

OK, got it. This was a bit tricky. As I suspected, we needed to aggressively filter out all blanks before ranking, including making sure that RANKX wasn’t ranking the total row. Here’s the revised measure that now produces the correct results for ASC:

Ranking FactA FactB ASC = 

IF (
    HASONEVALUE ( RawData[FACT A] ),
    RANKX (
        FILTER (
            CROSSJOIN ( ALL ( RawData[FACT A] ), ALL ( RawData[FACT B] ) ),
            [SumValues] <> BLANK ()
        ),
        [SumValues],
        ,
        ASC,
        DENSE
    )
)

image

The only thing left to figure out is how you want to handle ties. If you want to develop a custom tiebreaker to ensure that the measure is always returning exactly 10 records, I created a video on how to do that.

I hope this is helpful. Revised solution file posted below.

4 Likes

thanks,
one question we do need to perfrom this advance filtering all time we work with crossjoin?

Nice solution for the tiebreaker, at the moment the Dense option fit me.
Was wondering if sometimes when we work with number have decimal significant number and we would need to go further the 2 decimal to make it working without impacting the subsequent ranking.

I am at the begining with Power BI and DAX and get all time more and more curios of its capabilities.

luca

@LucaB72,

When it comes to Power BI, I try to avoid absolutes like never and always, but I would say almost always you will need to do some sort of pre-ranking filtering to deal with blanks when you’re using RANKX in combination with CROSSJOIN, since at least some of the combinations resulting from the Cartesian product of the two columns likely will have no observations associated with them.

Given the structure of your example, another approach would have been to use an ADDCOLUMNS/SUMMARIZE construct to create the virtual table on which the ranking would be done, that would have only generated the combinations that existed within the fact table. This approach would require less pre-filtering, since you would only have to worry about not ranking the total row.

In terms of going out to more significant digits, that’s a good way to avoid ties, and you can still format the output such that it rounds to a whole number or a smaller number of decimal places.

This is one of the fascinating things about DAX and Power BI – for almost any task or problem there are multiple valid ways to do it, each often with its own pros and cons.

I hope this is helpful.

– Brian

Actually, the way around I used before your DAX solution was to create a new table when importing the data in Power Query and use Group By, but you are right, ADDCOLUMNS may have worked better keeping more Attributes for futher slicing during the analysis

Luca

That’s not a bad approach if you’re going to be using that table for other purposes/analyses, or if you’re going to want to slice on a column in that table, but I generally try to keep my data model as clean and simple as possible, and thus avoid creating extra physical tables if I can do them virtually instead.

  • Brian
1 Like