Sorry - intended to work this one last night, but got surprised by the new Power BI version drop, and ended up working late on a video for tomorrow on the new Modern Visual Tooltip. Will work to get this one wrapped later tonight.
- Brian
Sorry - intended to work this one last night, but got surprised by the new Power BI version drop, and ended up working late on a video for tomorrow on the new Modern Visual Tooltip. Will work to get this one wrapped later tonight.
Hello @matty, Have you tried similar to Filtering the Top 3 products for each category in Power BI - SQLBI ?
@bharatsatyal something similar was provided by @AntrikshSharma
Thank you @BrianJ looking forward 
Just an update – I’ve still been working this one hard. Think I’m getting very close. Here’s my current DAX query. Just need to total up [@PLRevenue] within the proper context. Hopefully, have a solution to you tomorrow…
@Matty Use this:
Sales Report v3.pbix (981.4 KB)
3 Latest Sales by Revenue v5 =
VAR TopValues =
    CALCULATETABLE (
        VAR FinanceialLevelAndDates =
            ADDCOLUMNS (
                SUMMARIZE ( Data, 'Job category'[Financial level 1], 'Date'[Date] ),
                "@PL Revenue", [Revenue]
            )
        VAR RemoveZeroes =
            FILTER ( FinanceialLevelAndDates, [@PL Revenue] <> 0 )
        VAR MaxSalesInEachFinancialLevel =
            -- Add a new column that calculates max sales of each Financial level for the selected dates
            ADDCOLUMNS (
                RemoveZeroes,
                "@MaxSales",
                    VAR CurrentFinancialLevel = 'Job category'[Financial level 1]
                    VAR SameRows =
                        FILTER (
                            RemoveZeroes,
                            'Job category'[Financial level 1] = CurrentFinancialLevel
                        )
                    VAR MaxSales =
                        MAXX ( SameRows, [@PL Revenue] )
                    RETURN
                        MaxSales
            )
        VAR TopPL =
            TOPN ( 3, MaxSalesInEachFinancialLevel, [@MaxSales], DESC )
        RETURN
            TopPL,
        REMOVEFILTERS ( 'Job category'[Financial level 1] )
    )
VAR FinancialValuesInFilterContext =
    VALUES ( 'Job category'[Financial level 1] )
VAR IsIncludedInFilterContext =
    FILTER (
        TopValues,
        'Job category'[Financial level 1] IN FinancialValuesInFilterContext
    )
VAR Result =
    SUMX ( IsIncludedInFilterContext, [@MaxSales] )
RETURN
ResultThank you @BrianJ
Hi @AntrikshSharma,
The formula it’s going in the wrong direction as you are taking to count Max sales for that day.
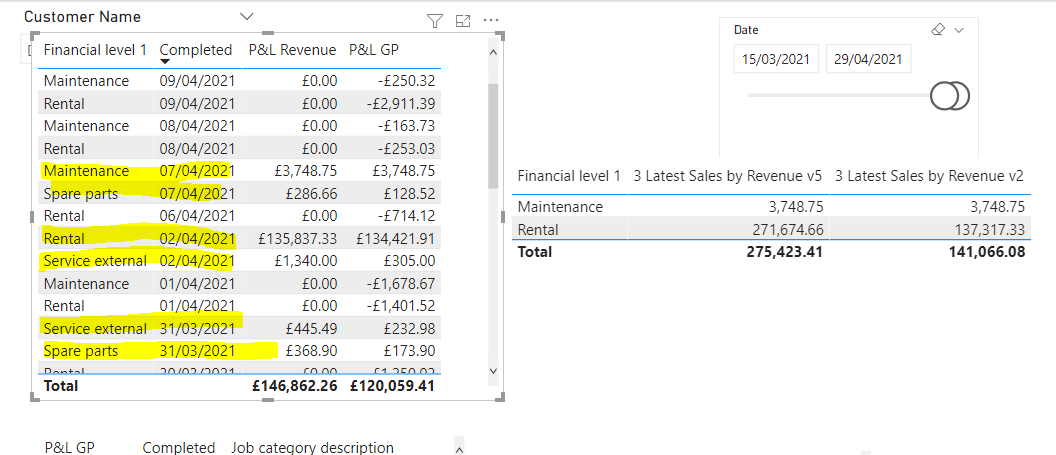
Base on the date sclier:
We should get the Last 3 Sales days but (skipped 0 Revenues), therefore the result should be
07.04.2021 Maintenance 3,748.75
07.04.2021 Spare Parts 286.66
02.04.2021 Rental 135,837.33
02.04.2021 Service external 1,340.00
31.03.2021 Service external 445.49
31.03.2021 Spare parts 368.90
Since I display by Finance Level the result, we should get:
Maintenance 3,748.75
Rental 135,837.33
Service external (1340+444.49) = 1784.49
Service Parts (286.66 + 368.90) = 655.56
The closest pattern that nearly worked was:
The above formula pattern works in 95%( I would say) but the issue is that the pattern includes 07/04/2021 and 06/04/2021 and 02/04/2021 whereas it should include only the P&L sales where <> 0 so 07/04/2021 and 02/04/2021 and 31/03/2021.
The correct result is missing 31/03/2021
Maintenance 3,748.75
Rental 135,837.33
Service external (1340+444.49) = 1784.49
Service Parts (286.66 + 368.90) = 655.56
Hello everyone! Bumping this post for more visibility.
Thanks for your patience – I haven’t given up on this at all. Can you please upload the Excel data file? For my solution path to work, I think I’m going to need to create a physical index in Power query.
Thanks.
– Brian
@BrianJ Sure,
Please find the attached data sources that I used:
Data.txt (5.2 MB) Job category hierarchy.xlsx (20.8 KB)
Be careful using data in the text format
In the query editor, I used split text by positions:
Thank you!
Matty
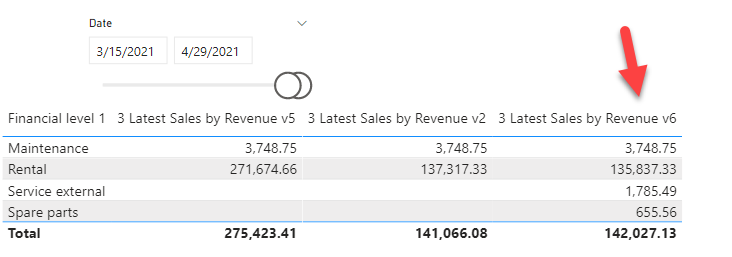
@Matty I didn’t realize your requirement is based on last 3 dates, my bad, this will work based on details provided in your last post.
3 Latest Sales by Revenue v6 =
VAR FinacialLevelInFilterContext =
VALUES ( 'Job category'[Financial level 1] )
RETURN
CALCULATE (
VAR FinancialLevelAndSelectedDates =
SUMMARIZE ( Data, 'Job category'[Financial level 1], 'Date'[Date] )
VAR FinancialLevelAndDatesWithSales =
ADDCOLUMNS ( FinancialLevelAndSelectedDates, "@Revenue", [P&L Revenue] )
VAR RemoveZeroes =
FILTER ( FinancialLevelAndDatesWithSales, [@Revenue] <> 0 )
VAR KeepOnlyDates =
DISTINCT ( SELECTCOLUMNS ( RemoveZeroes, "@Date", 'Date'[Date] ) )
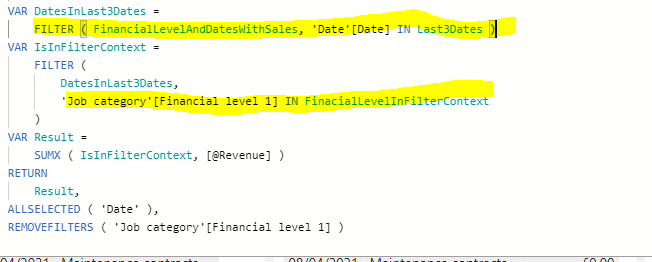
VAR Last3Dates =
TOPN ( 3, KeepOnlyDates, [@Date], DESC )
VAR DatesInLast3Dates =
FILTER ( FinancialLevelAndDatesWithSales, 'Date'[Date] IN Last3Dates )
VAR IsInFilterContext =
FILTER (
DatesInLast3Dates,
'Job category'[Financial level 1] IN FinacialLevelInFilterContext
)
VAR Result =
SUMX ( IsInFilterContext, [@Revenue] )
RETURN
Result,
ALLSELECTED ( 'Date' ),
REMOVEFILTERS ( 'Job category'[Financial level 1] )
)
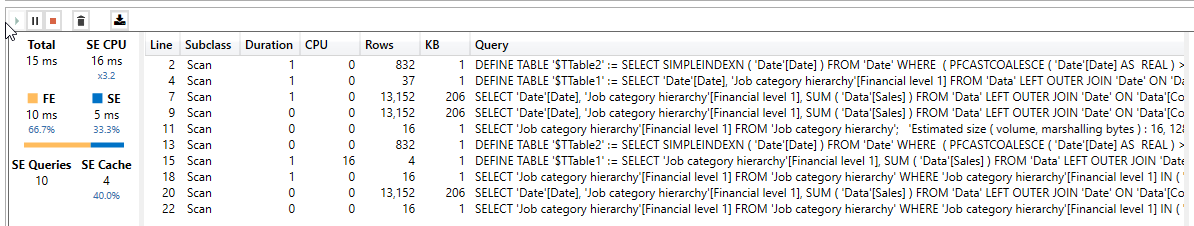
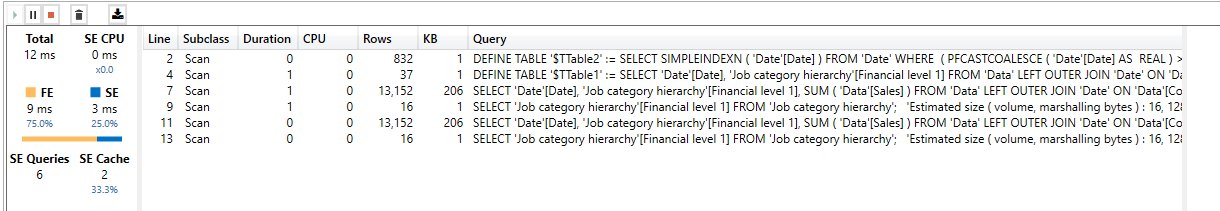
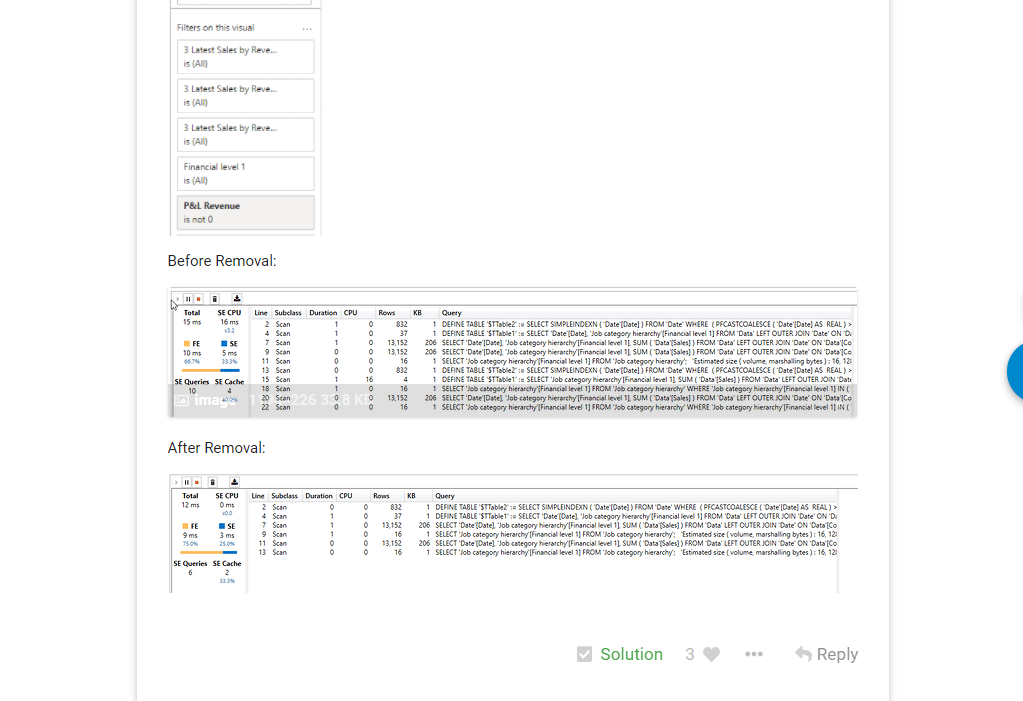
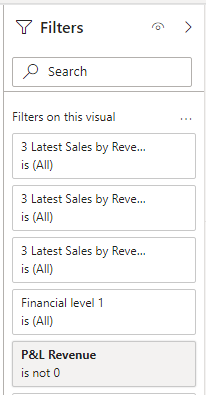
Also if your production data is huge then see if you can remove that P & L Revenue <> 0 from the filters pane, it will optimize the code.
Before Removal:
After Removal:
@AntrikshSharma WoW Thank you very much !
It works !!
2 questions:
1.I noticed that I need to make active reliationship between the dates. Would it be possible to keep it unactive or you would suggest keep it active?
Thank you!

Nice job, @AntrikshSharma!
@Matty - IN is an incredibly useful function/pattern. Here’s a great deep dive article on its use:
@Matty You will need to keep the relationship active, because of the SUMMARIZE function that I have used. If it is not required don’t do that, and for some specific measures just use CROSSFILTER to block the filters. Also, USERELATIONSHIP in large data will be slower than physical relationship so you need to keep that in cosideration.
Thank you both @AntrikshSharma @BrianJ for an explanation!
Really appreciate your help!
Just to get a better overview and understanding, if I would turn off the relationships between data and dates table would I have to replace Summarize with Crossfilter?
Or could you just provide example video that I could reference
Thank you!
@Matty If the dataset isn’t confidential ( which it shouldn’t be since it is on the forum ) I could think about creating a video, let me know if I can use this data.
Also, it is unfair to mark your post as solution, please change it to mine.
I am pretty sure that I marked your solution (apologise if I didn’t):
Go a head, please use the data but just use the static information
Thanks @Matty, I didn’t get the ‘static’ part, can you please ellaborate?
@AntrikshSharma If you could use the raw data that is already in PBI file, I will appreciate it
Please let me know if you are going to do a video