TOPN 3 latest sale -other pattern

Hi DNA Team,

I’m kind of stuck on one issue, and I will appreciate it if you could give me a hint.

I am trying to calculate 3 latest gross sales and revenue sales:

3 Latest Sales by GP = SUMX(
TOPN(3, CALCULATETABLE(
SUMMARIZE(Data,Data[Completed]),ALL(‘Job category’)),
Data[Completed],DESC),
[P&L GP])

3 Latest Sales by Revenue = SUMX(
TOPN(3, CALCULATETABLE(
SUMMARIZE(Data,Data[Completed]),ALL(‘Job category’)),
Data[Completed],DESC),
[P&L Revenue])

I run into an issue when the data is displayed by revenue:

I do understand why this is happening, as we summarized the data by Data[Completed] and to each date, there is a job category.

I was wonder is there any other pattern that we could use instead of the TOPN function?

I would like to display the revenue for the last 3 sales that occurred but to have it dynamically so I could filter by date.

If I am applying the date filter on the page Last 3 Sales by GP or Revenue will be blank once it reaches 07/04/2021. This happens due to TOPN formula.

I am not looking for the answer as I would like to give it a go but I will appreciate a hint from you :slight_smile:

Sales Report.pbix (938.0 KB)

@Matty,

First, hats off to you for wanting to work this out yourself and just getting a hint from the forum - great way to maximize your own learning.

My recommended path would be to switch from TOPN to a RANKX-based approach, and nest your RANKX measure within an IF statement that returns the measure value if <= 3 and returns BLANK() otherwise.

I hope this is enough to nudge you on track to your solution. Give a shout if you need any further assistance.

– Brian

2 Likes

Hi @Matty. I don’t have time right now to dive into your specific problem, but, if the data volume is not too high, have often used RANKX to calculate a rank, then filtered the results to keep only those below a specified rank (in your case <= 3). Perhaps that will help.
Greg

2 Likes

Hi @Matty, did the response provided by the users and experts help you solve your query? If not, how far did you get and what kind of help you need further? If yes, kindly mark as solution the answer that solved your query. Thanks!

Hi @Matty, we’ve noticed that no response has been received from you since the 23rd of April. We just want to check if you still need further help with this post? In case there won’t be any activity on it in the next few days, we’ll be tagging this post as Solved.

Apologies @EnterpriseDNA over past 3 days I was extremely busy with University work :frowning:

Today I am planing to give a go with RANKX formula and see where it take me (finger crossed),

I will post updated file :slight_smile:

Thank you,

Matty

1 Like

Hi @BrianJ @Greg

I am kind of stuck.
Sales Report.pbix (939.5 KB)

Firstly I calculate GP sales using RANKX:

Rank 1 =

CALCULATE([P&L GP],

FILTER(VALUES(‘Job category’[Job category description]),

RANKX(ALL(‘Job category’[Job category description]),[P&L Revenue],DESC)))

But then I as I mentioned I would like to see to last three sales so I thought I can use this pattern:

Rank 3 =

CALCULATE([P&L GP],
FILTER(VALUES(‘Job category’[Job category description]),
RANKX(CROSSJOIN(ALL(‘Job category’[Job category description]),ALL(‘Date’[Date])),[P&L Revenue],DESC) <=3 ))

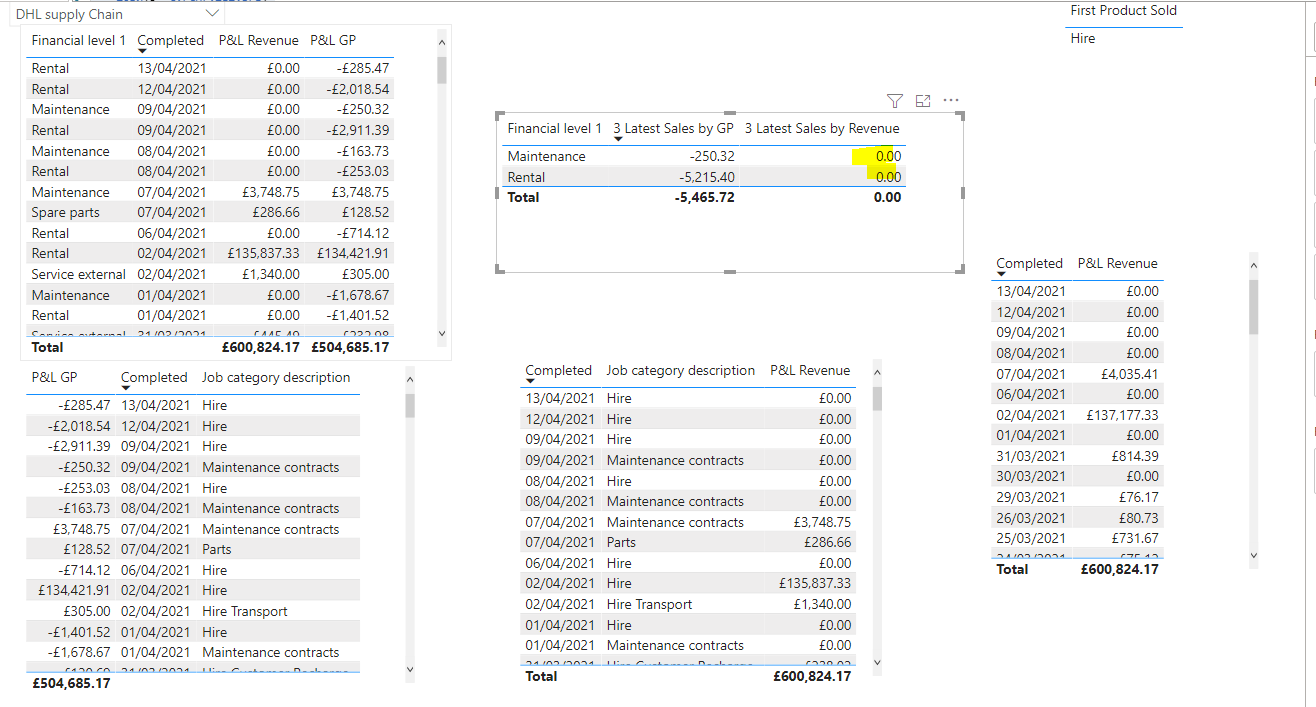
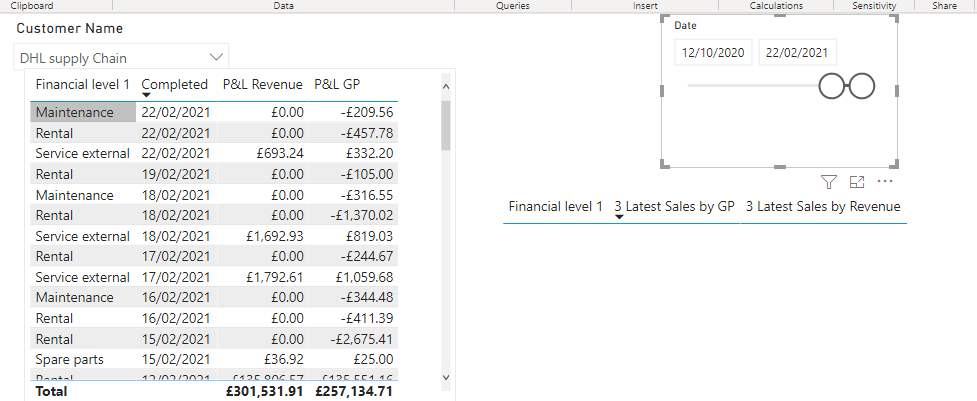
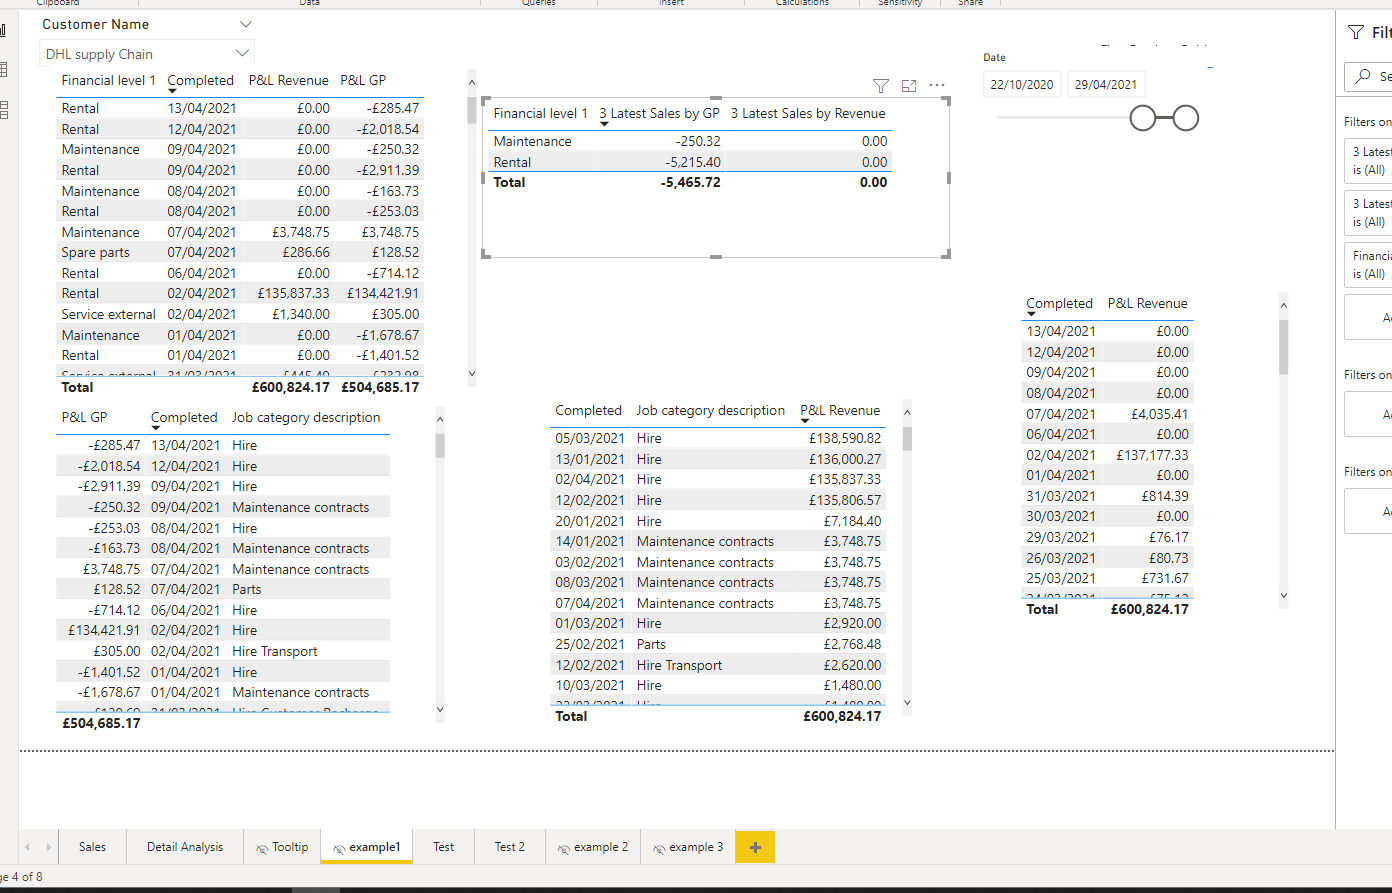
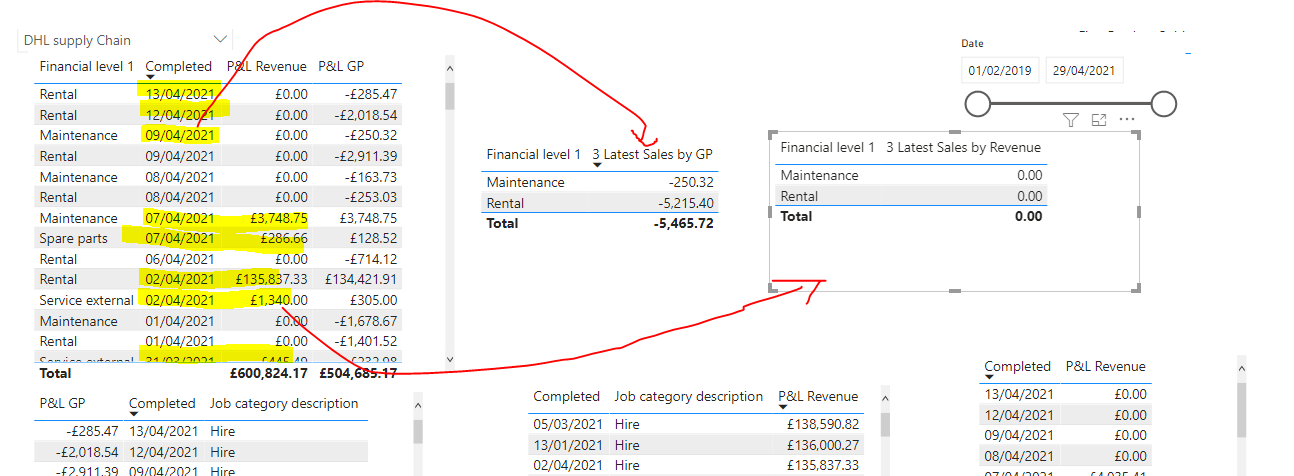
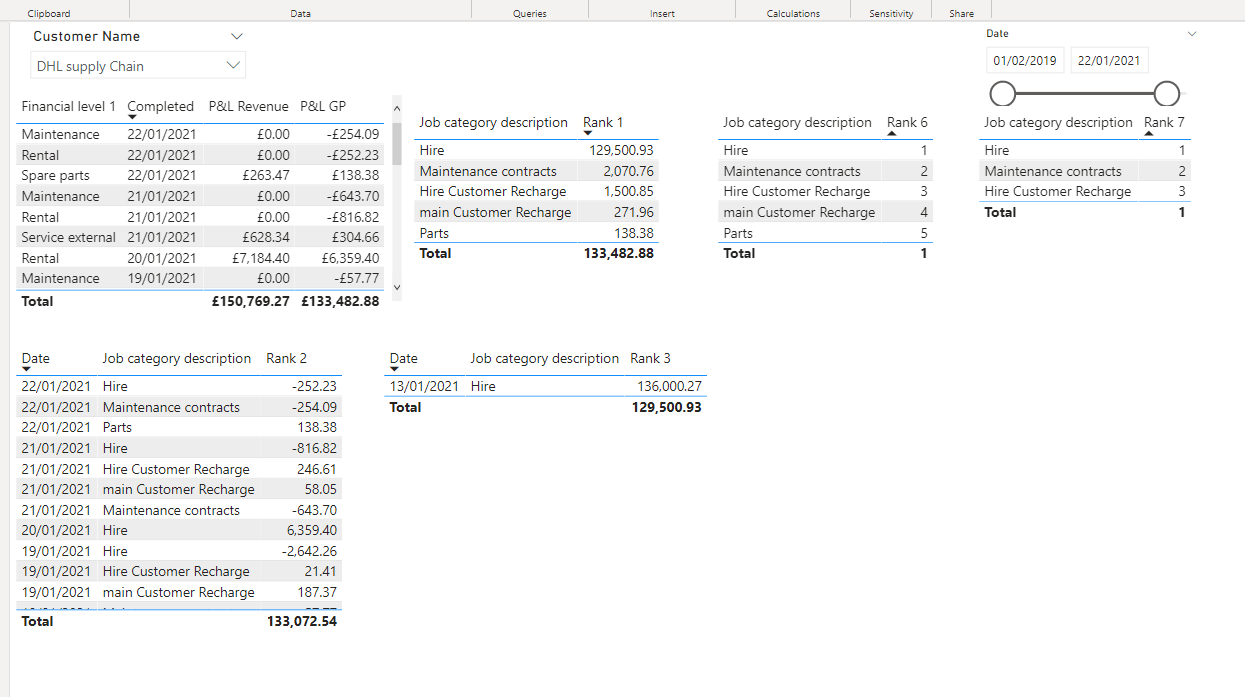
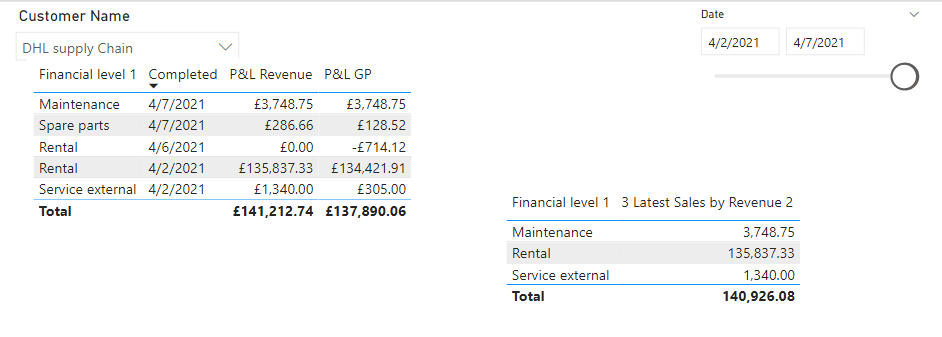
The result is correct but it is not what I am trying to get. Like mentioned before I am trying to calculate last 3 sales but I would like to have it with the interaction of the date slicer.

I am trying to figure out how can I calculate the last 3 GP transaction by completed dated and be able to filter by Max date selected on the slicer.

If I would filter Max date to 22/01 I should only see these 3 days and total:

Once again I will appreciate the hint so I could give a go on my own :slight_smile:

Thank you,

Matty

@matty,

Here’s the way I would tackle this in a general sense:

  1. create a disconnected date table slicer
  2. harvest the values of that
  3. build a RANKX-based measure with a variable that returns a one column table containing top three dates, subject to the filter condition set by the harvested values from 2). The result of that measure will check each selected date value in the visual to see whether that value is in the one column table variable, and the measure will return a 1 if it is, and a 0 if not.
  4. throw the measure created in 3) into the filter pane for the relevant visuals (either at the individual visual level, or at the page level) and set it equal to 1.

I hope this is helpful, and puts you on the right track to a solution.

  • Brian

P.S. While not a RANKX-based problem, this solution that I provided yesterday uses all the other aspects of the strategy I laid out above.

2 Likes

Thank you @BrianJ I will give a go tomorrow evening :slight_smile:

Thank you,

Matty

1 Like

@Matty,

Sure - love your approach to learning on this. Good luck, and just give a shout if you run into problems.

– Brian

1 Like

Hi @Matty did the response provided by @BrianJ help you solve your query? If not, how far did you get and what kind of help you need further? If yes, kindly mark as solution the answer that solved your query. Thanks!

1 Like

@EnterpriseDNA Still working on it :slight_smile: I will provide an update today if I get the correct result :slight_smile:

1 Like

Sales Report.pbix (961.6 KB) Dear @BrianJ ,

I am sorry but I tried and honestly speaking I do know how to do it :frowning: .

I read the post that you shared to get some hints.

I will appreciate if you could help me.

Thank you,

Matty

1 Like

Hi @BrianJ

point 3:

Do you mean formula should look like the below:

Rank 9 =

CALCULATE([P&L GP],
FILTER(VALUES(‘Job category’[Job category description]),
RANKX(CROSSJOIN(ALL(‘Job category’[Job category description]),ALL(‘Disc Date’)),[P&L Revenue],DESC) <=3 ))

OR somehow I shuold include:

Disconnected Date = VALUES(‘Disc Date’[Date]) ?

Or do we need to include :

Date In = IF(
SELECTEDVALUE( ‘Date’[Date] ) IN VALUES( ‘Disc Date’[Date] ),
1,
0
) ?

Thank you,

Matty

1 Like

@Matty

3 Latest Sales by Revenue = 
CALCULATE ( 
    [P&L Revenue],
    KEEPFILTERS ( 
        TOPN (
            3,
            ALL ( 'Job category'[Financial level 1] ),
            [P&L Revenue], DESC
        )
    )
)

@AntrikshSharma Hi :slight_smile:

I have this formula build into my model but I was trying to get the dynamic result based on the date filter.

3 Latest Sales by GP = SUMX(
TOPN(3, CALCULATETABLE(
SUMMARIZE(Data,Data[Completed]),ALL(‘Job category’)),
Data[Completed],DESC),
[P&L GP])

The result that I would like to get is to show the last 3 sales that happened and to have it dynamic (using date slicer)

I added your formula to my model but it will bring the total of TOP3 overall by financial level.

For GP I would like to see as it is but for revenue 07/04/2021, 02/04/2021 (where the sales occurred)

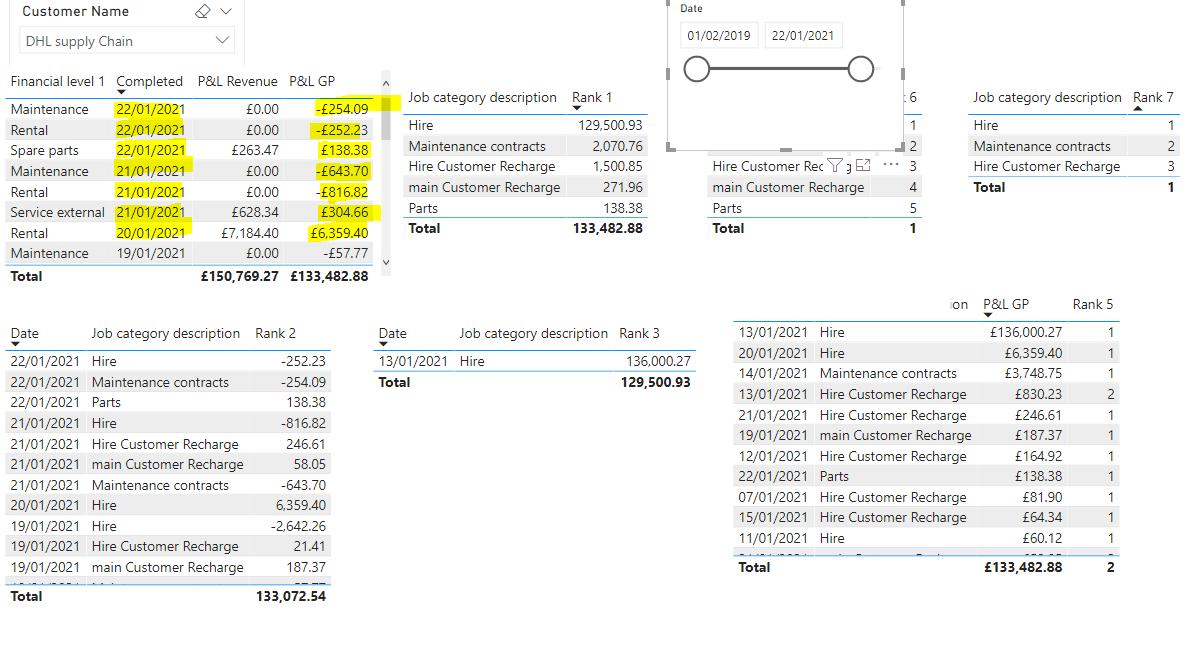
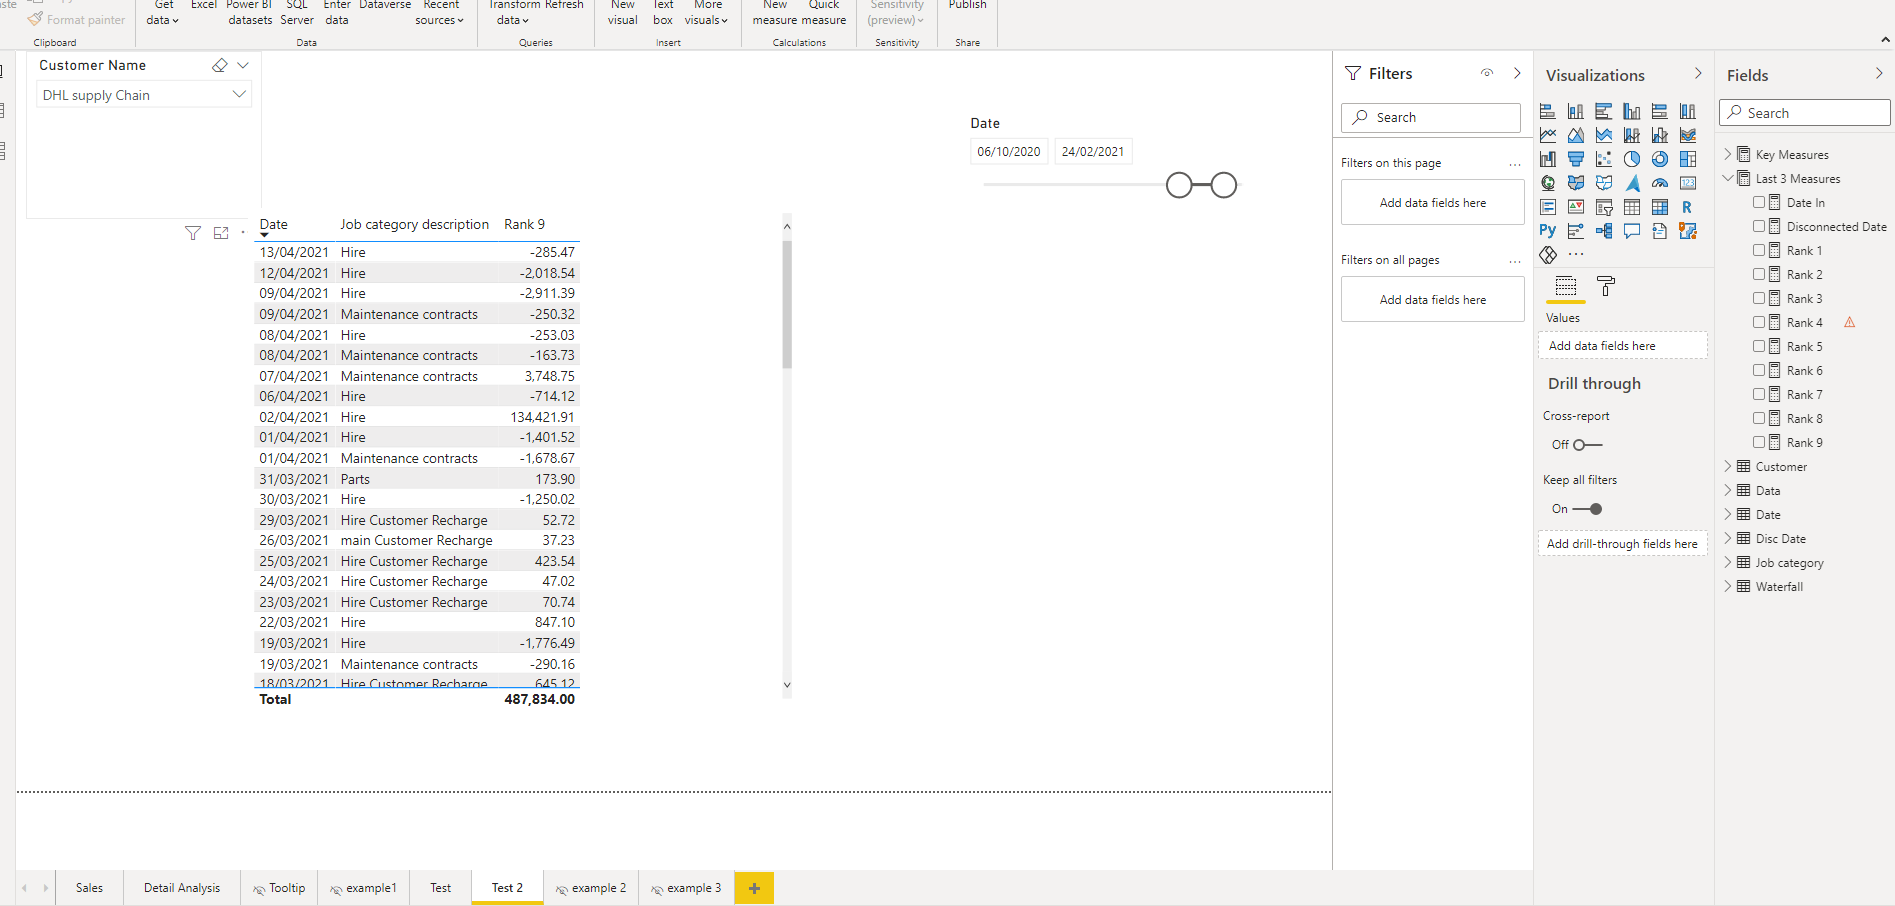
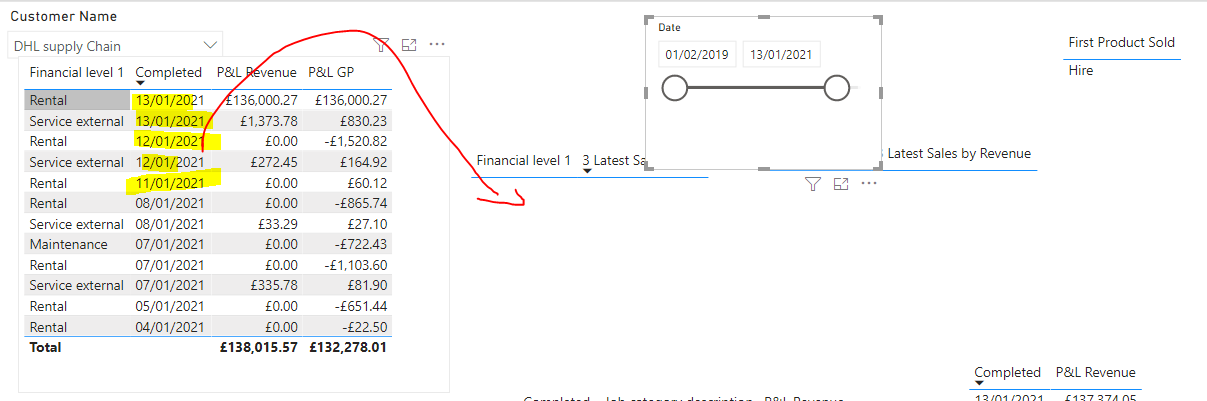
The issue that I have I can’t make it dynamically using date slicer:

If I filter the date slicer to 13/01/2021 then TOP3 will not provide me the result that I want to see, that’s why I tried to use the RankX formula but unfortunately, I am not that good as you guys. Brian did give me hints on how I should approach this topic but I am failing it :frowning:

On the Test Page, you will see rank formulas that I tried to use but I wasn’t successful same on the test2 page.

Would be able to help please ?

@Matty,

Sorry - I’ve been bogged down with a couple of big projects. Will take a look on Sunday and get back to you.with a solution.

  • Brian

@Matty See if this helps.

3 Latest Sales by Revenue 2 =
SUMX (
    FILTER (
        CALCULATETABLE (
            VAR Temp =
                ADDCOLUMNS (
                    SUMMARIZE ( Data, 'Job category'[Financial level 1], Data[Completed] ),
                    "@PL Revenue", [P&L Revenue]
                )
            VAR TempWithoutBlank =
                FILTER ( Temp, [@PL Revenue] <> 0 )
            VAR TopPL =
                TOPN ( 3, TempWithoutBlank, [@PL Revenue], DESC )
            RETURN
                TopPL,
            REMOVEFILTERS ( 'Job category'[Financial level 1] )
        ),
        'Job category'[Financial level 1]
            IN VALUES ( 'Job category'[Financial level 1] )
    ),
    [@PL Revenue]
)

Alternate version:

3 Latest Sales by Revenue 2 =
CALCULATE (
    [P&L Revenue],
    KEEPFILTERS (
        CALCULATETABLE (
            VAR Temp =
                ADDCOLUMNS (
                    SUMMARIZE ( Data, 'Job category'[Financial level 1], Data[Completed] ),
                    "@PL Revenue", [P&L Revenue]
                )
            VAR TempWithoutBlank =
                FILTER ( Temp, [@PL Revenue] <> 0 )
            VAR TopPL =
                TOPN ( 3, TempWithoutBlank, [@PL Revenue], DESC )
            RETURN
                TopPL,
            REMOVEFILTERS ( 'Job category'[Financial level 1] )
        )
    )
)

Hi @BrianJ No problem no rush.

Thank you @AntrikshSharma for your help, honestly appreciated it.

I studied your formula to have a better understanding, I added few comments, do you mind to check it?
What is the reason to add Keepfilters? This is the first time I think where I’ve seen VAR functions used inside of formula pattern.
Usually, I used and seen on yt VAR 1, VAR 2 etc Return Calculate,VAR1,VAR2 etc. whereas your pattern is completely different level. Thank you for showing me this!

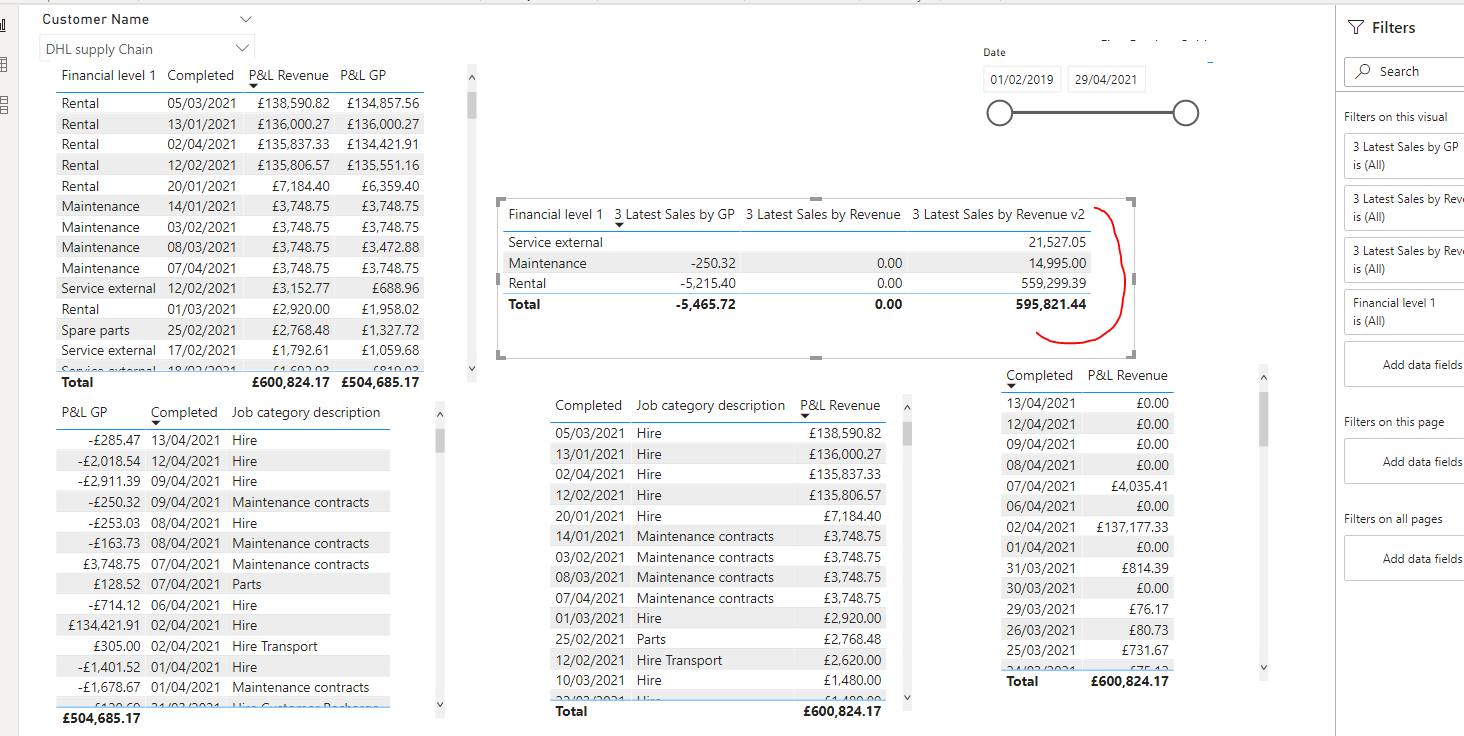
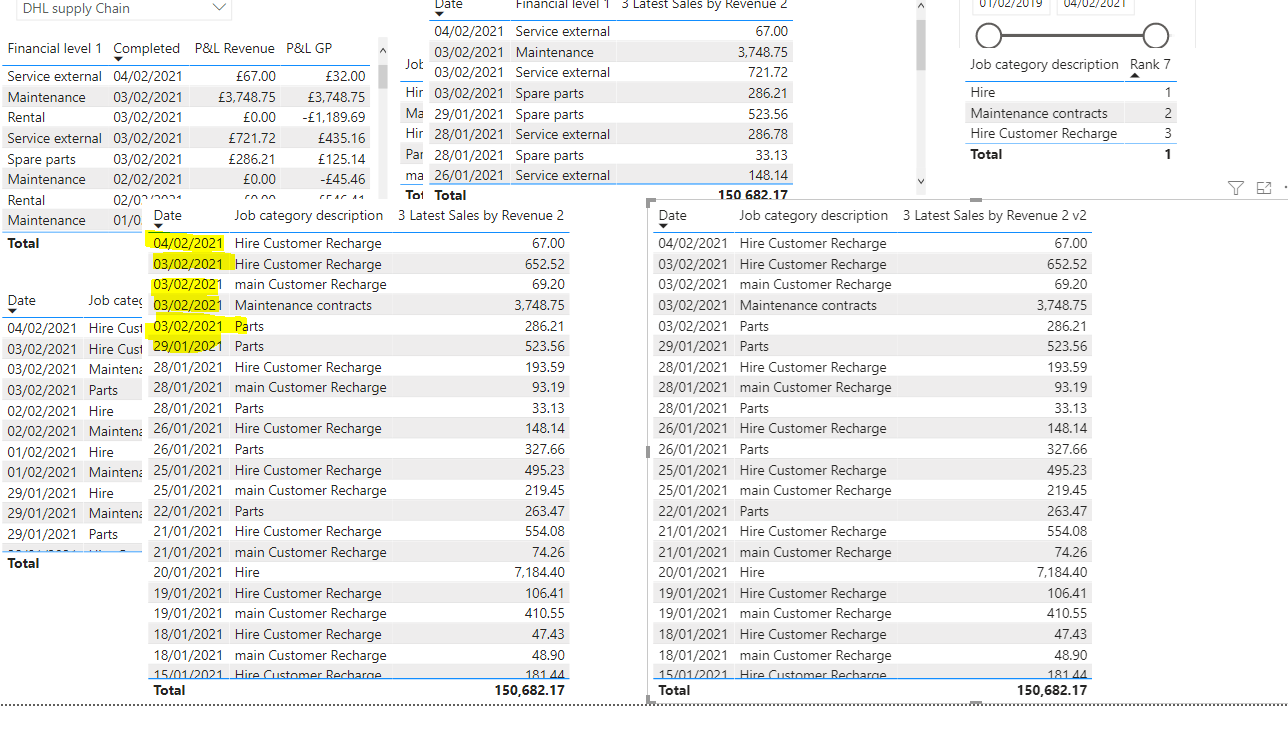
3 Latest Sales by Revenue 2 v2 =
CALCULATE (
[P&L Revenue],
//Calculate revenue
//why do we use keepfilters KEEPFILTERS (
CALCULATETABLE (
VAR Temp =
ADDCOLUMNS (
SUMMARIZE ( Data, ‘Job category’[Financial level 1], Data[Completed] ),
@PL Revenue”, [P&L Revenue]
) // Creates a table for each job category and date completed, adding extra column with revenue for that date and job
VAR TempWithoutBlank =
FILTER ( Temp, [@PL Revenue] <> 0 )
// filtering above table to remove revenue that doesnt equal to 0
VAR TopPL =
TOPN ( 3, TempWithoutBlank, [@PL Revenue], DESC )
// calcuate top 3 from above table
RETURN
TopPL,
REMOVEFILTERS ( ‘Job category’[Financial level 1] )
//remove filter on job category? so we can filter the data by job category or financial level?
)
)
)

The formula pattern nearly works meaning I can apply the date slicer filter but the results don’t give me TOP3 dates.

Thank you,

Matty

@Matty CALCULATETABLE returns a list of Financeal Level 1, when these values are applied to the filter context they will overwrite the existing filter and you will only get the Total P & L of all those values, so to not overwrite the existing filter and to create an intersection between filter context outside CALCULATE and inside CALCULATE we need to use KEEPFILTERS.

REMOVEFILTERS is used so that at each cell of the visual all the Financial Level are visible otherwise TOPN will only receive 1 row containing the value visible in the current cell of the report.

Regarding the above requirement, I see you are using different columns so the granularity is also different, try to adjust the formula accordingly.