Top Sales Persons with 5 or more orders

Hi all,

I am sure this will be a quick one for our experts here, but my Dax and Googling skills are failing me.

Please see attached mockup: Top Sales People with more than 5 Orders.pbix (60.0 KB)

I have a [Enquiries] table, which gives us:

Enquiry Date
Sales Person
Enquiries
Orders

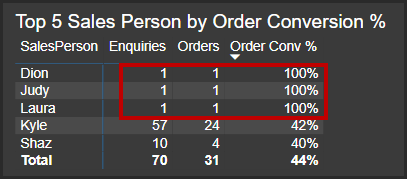
I then have a measure [Order Conversion %], which is simply [Enquiries] / [Orders]. We then want to present a ‘Top 5 Sales Persons by Order Conversion %’ table:
image

However, as highlighted above, we do have instances where a Sales Person may only have 1 Enquiry and 1 Order and they are therefore at the top of the table.

We therefore want to amend this so that the Sales Persons only make it into the Top 5 Sales table if they have more than 5 orders.

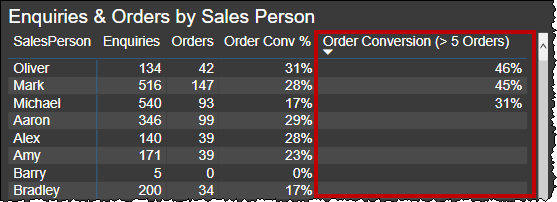
I tried using the measure below but it is not working as desired:

image

image

I have also tried applying a filter to the table, but again now working:
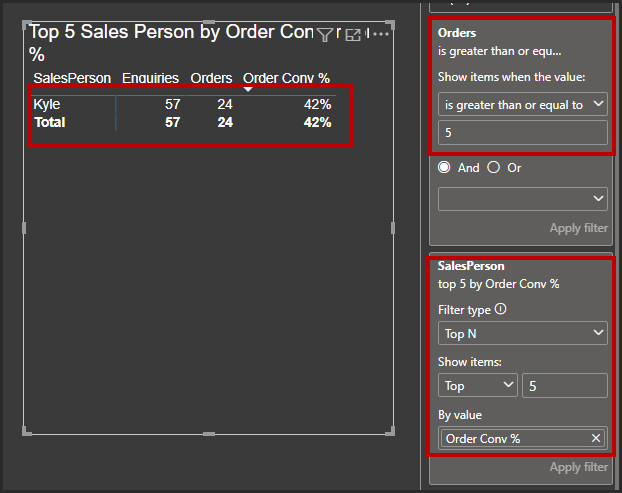
image

Ideally I want a measure which returns the Top 5, but only where Total Orders > 5 and not use any Top 5 filtering in the table itself.

Many thanks

Mark
Hello @Mark,

Thank You for posting your query onto the Forum.

Well, when you wrote the measure like this -

Order Conversion (> 5 Orders) = 
CALCULATE( [Order Conv %] ,
    FILTER( Enquiries ,            
        [Orders] > 5 ) )

In this case, it actually evaulated the condition where Orders > 5 per day. And that’s why it started to gave ambiguous results. Since you want to show the collective order figures more than 5 and not per day. The formula will be like this (just a small change to the above formula) -

Total Orders > 5 = 
CALCULATE( [Order Conv %] ,
    FILTER( Enquiries ,            
        SUM( Enquiries[Orders_] ) > 5 ) )

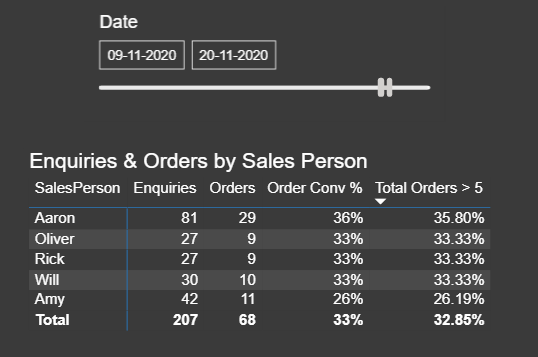
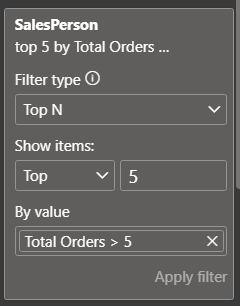
Now, put the above formula under the FILTER pane. Below is the screenshot provided for the reference -

FILTER PANE

And now, you’ll have the desired result that you’ve been looking for. Below is the screenshot provided for the reference -

Resultant Output

I’m also attaching the working of the PBIX file for the reference.

Hoping you find this useful and meets your requirements that you’ve been looking for. :slightly_smiling_face:

Note: This result is also achievable via TOPN function but in this case I didn’t used it to keep it simple since the same result was achieved via TOPN filter option.

Thanks and Warm Regards,
Harsh

Top Sales People with more than 5 Orders - Harsh.pbix (60.6 KB)

3 Likes

Hi @Harsh

Perfect, thank you so much for you clear and detailed explanation :smiley:

One more question if I may…

In my real world report, my Enquiries dataset doesn’t actually include a numeric count of [Orders] as I had put in my mockup. Instead, we have an [Order Date] field on each row and if it is populated we count that as an order, eg:

Orders 2 = 
CALCULATE(COUNTROWS('Enquiries 2'), 
    'Enquiries 2'[Order Date] <> BLANK()
)

I now understand the need to use a SUM to obtain my Orders > 5, however is there a way to do this, without having to add an additional calculated column to my fact table which can then be used in a SUM, eg:

Order Int = IF('Enquiries 2'[Order Date] <> BLANK(), 1)

Followed by:

Order Conv 2 (GT 5 Orders) = 
CALCULATE([Order Conversion % 2], 
    FILTER('Enquiries 2', SUM('Enquiries 2'[Order Int]) > 5)
)

I hope the above question is clear, see v2 attached which has a new [Enquires 2] table which demonstrates:

Top Sales People with more than 5 Orders v2.pbix (84.2 KB)

Thanks again,

Mark

Hello @Mark,

Well, you don’t have to create an additional column “Order Int” to get the sum of Orders.

You have already created the measure for orders i.e. “Orders 2” and this measure is absolutely sufficient to achieve the results in your real world report.

This is measure that you’ve created for “Orders 2” -

Orders 2 = 
CALCULATE( COUNTROWS('Enquiries 2') , 
    'Enquiries 2'[Order Date] <> BLANK() )

Now, in order to calculate the “Top 5 Salesperson With More Than 5 Orders Conversion” firstly you created calculated column and than you substituted that column in your measure to achieve the result. Below is the formula that you’ve written -

Order Conv 2 (GT 5 Orders) = 
CALCULATE( [Order Conversion % 2] , 
    FILTER( 'Enquiries 2' , 
        SUM( 'Enquiries 2'[Order Int] ) > 5) )       -- Calculated Column created in order to get the SUM

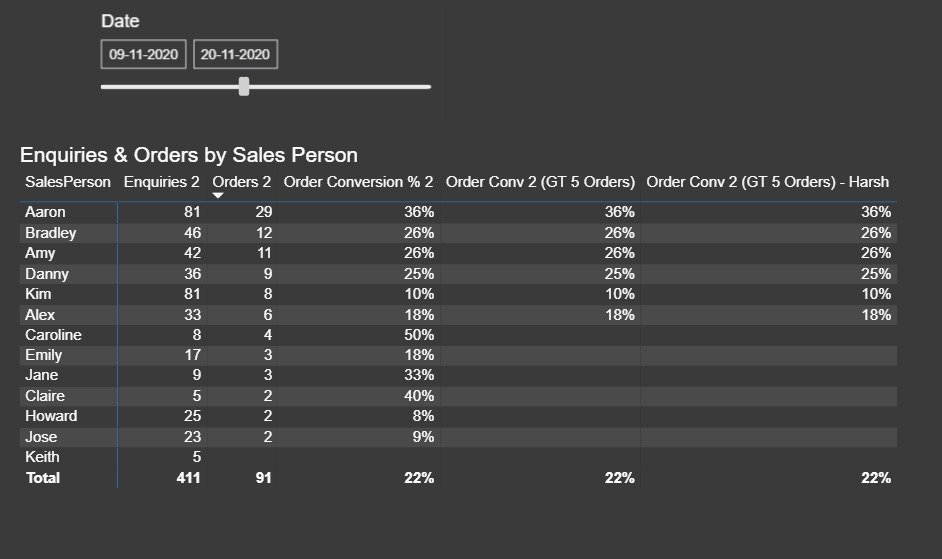
The thing is, as I said during the start of the post, “Orders 2” measure is good to go to achieve the results. Below is the formula/measure provided for the reference (without creating calculated column) which I’ve written to achieve the same results -

Order Conv 2 (GT 5 Orders) - Harsh = 
CALCULATE( [Order Conversion % 2] , 
    FILTER( 'Enquiries 2' , 
        SUMX( 'Enquiries 2' , 
            [Orders 2] ) > 5 ) )       -- I've substitued the Orders 2 measure inside the SUMX function to achieve the results

I’m also attaching the working of the PBIX file for the reference.

Hoping you find this useful and meets your requirements that you’ve been looking for. :slightly_smiling_face:

Thanks and Warm Regards,
Harsh

Top Sales People with more than 5 Orders v2 - Harsh.pbix (84.3 KB)

1 Like

Hi @Harsh,

Perfect. Thank you once again for the detail response and really glad I asked the additional query! Measures now changed to use SUMX to iterate through and allow the sum.

Cheers

Mark