Top N not showing correct numbers

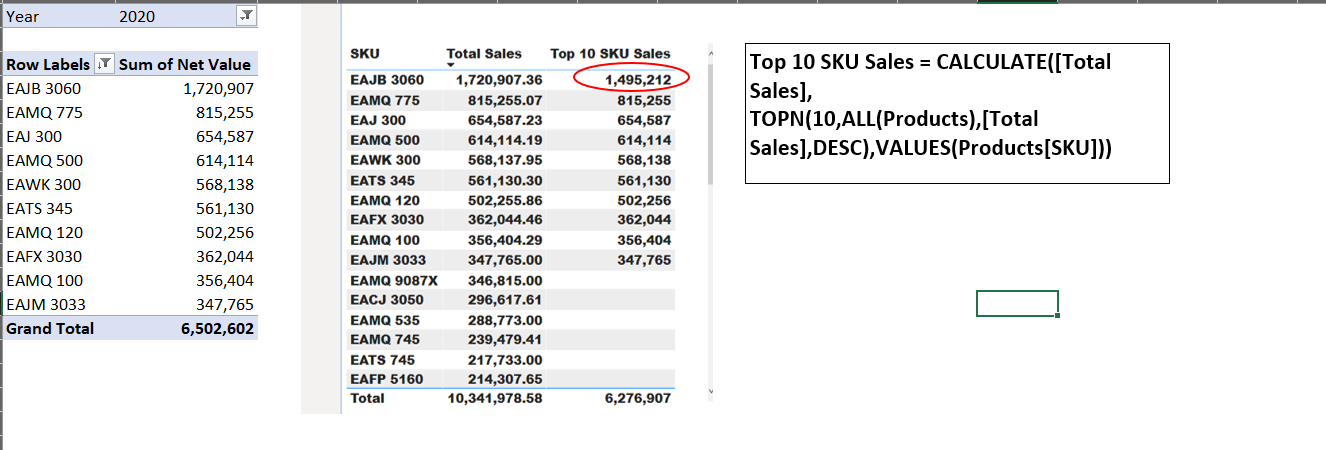
Hi All, I have used the Top N function to derive Top 10 SKU Sales , but when I compare it with the excel version pivot table , the results show different numbers for some. There is a filter slicer that filters the year for 2020.
I have used the following DAX function:

Top 10 SKU Sales = CALCULATE([Total Sales],
TOPN(10,ALL(Products),[Total Sales],DESC),VALUES(Products[SKU]))

Please advice what am I doing wrong.
Thanks,
Mustafa

Hi @chris786 .

To help us further analyze your current state and visualize your issue, could you please provide as many as you can of:

  • Your work-in-progress PBIX file, using sanitized data if necessary
  • Your dataset as an Excel file (again, sanitized if necessary)
  • A detailed mock-up (marked-up screenshot or Excel file) of your desired outcome.

Also, if you provide DAX in your post, please format it using the built-in formatter.

Greg

_eDNA Forum - Format DAX

Hi Greg,
Sure I can, here you go.
Last 5 Year Sales(check).pbix (975.2 KB)

Thanks,
Mustafa

Hello @chris786,

Thank You for posting your query onto the Forum.

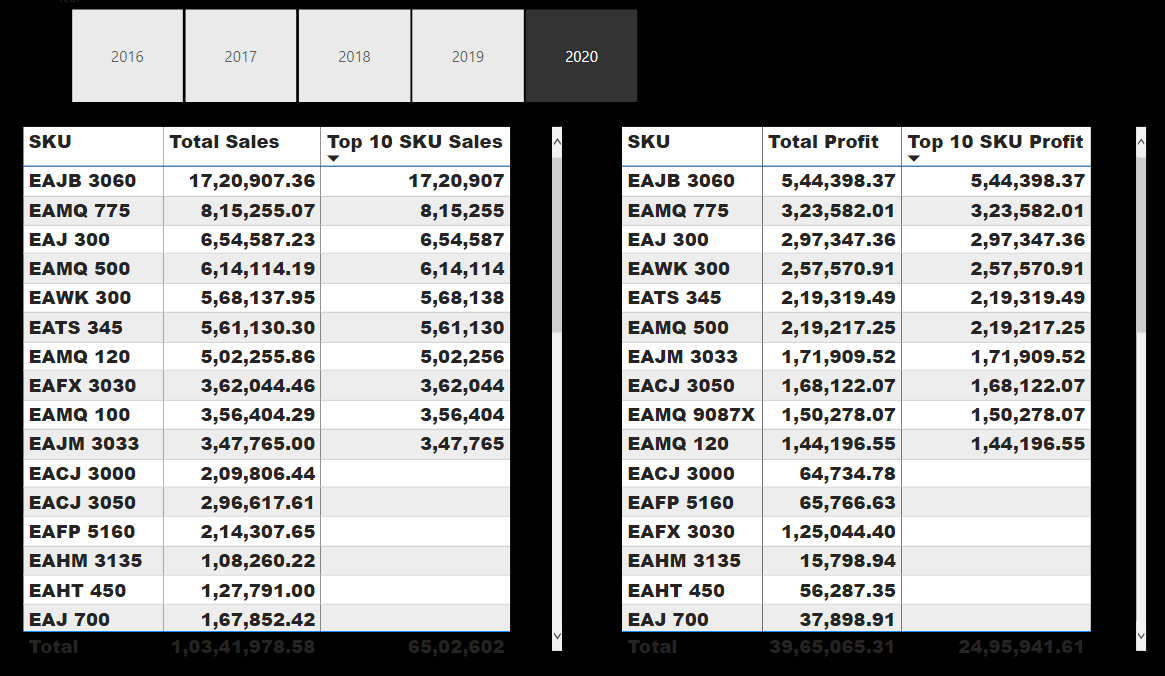
Well, there was minor fix into the formula and the results will be achieved as you’re expecting. You’d reference the formula as “ALL( Products )” i.e. referencing the naked table whilst it should have been “ALL( Products[SKU] )” referencing a particular column. Below are the formulas alongwith the screenshot of the result provided for the reference -

Top 10 SKU Sales = 
CALCULATE( [Total Sales] ,
    TOPN( 10 , ALL( Products[SKU] ) , [Total Sales] , DESC ) , 
        VALUES( Products[SKU] ) )


Top 10 SKU Profit = 
CALCULATE( [Total Profit] ,
    TOPN( 10 , ALL( Products[SKU] ) , [Total Profit] , DESC ) , 
        VALUES( Products[SKU] ) )

I’m also attaching the working of the PBIX file for the reference.

Hoping you find this useful and meets your requirements that you’ve been looking for. :slightly_smiling_face:

Thanks and Warm Regards,
Harsh

TOPN - Harsh.pbix (970.5 KB)

3 Likes

Super!..Got it, its a subtle change that can make a difference.
ALL accepts a table or a column, how would one know when to use which one as it can be quite easily confusing.

Many thanks,
Mustafa

Hello @chris786,

I’m providing a link below where it showcases alongwith the examples about what difference does it makes and when to use which option.

Hoping you find this useful. :slightly_smiling_face:

Thanks and Warm Regards,
Harsh

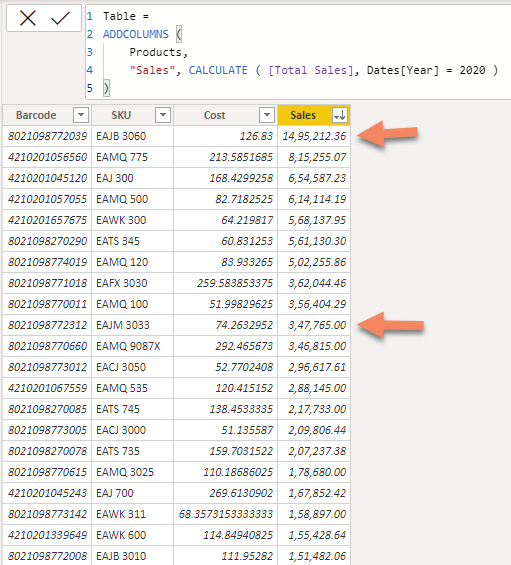
@chris786 The thing to remember is deciding the right granularity your DAX calculation is to be done on. Context Transition is adding Barcode, SKU and Cost into an equivalent filter context, since you are iterating full table, there are going to be multiple rows for each SKU.

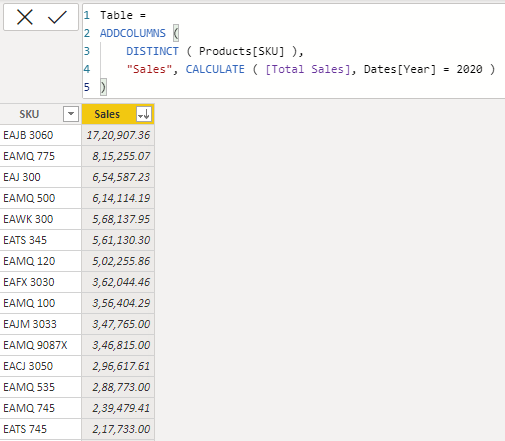
When you write ALL ( Products ) and sort by Sales, only one row of EAJB 3060 is visible in the Top 10.

Orange pointers are for 1st and 10th row

When you Bring it to right granularity, Context transition has to add only EAJB 3060 as a filter context and not Barcode and Cost
image

If you increase/decrease granularity of the report by adding or removing another column you need to add or remove the column from your code as well.

2 Likes

Thanks Antriksh, :smiley:
I tried it and understood the full table vs column transition.

Much appreciated.

Hi @chris786, did the response provided by the experts help you solve your query? If not, how far did you get and what kind of help you need further? If yes, kindly mark the thread as solved. Thanks!