Hi all,
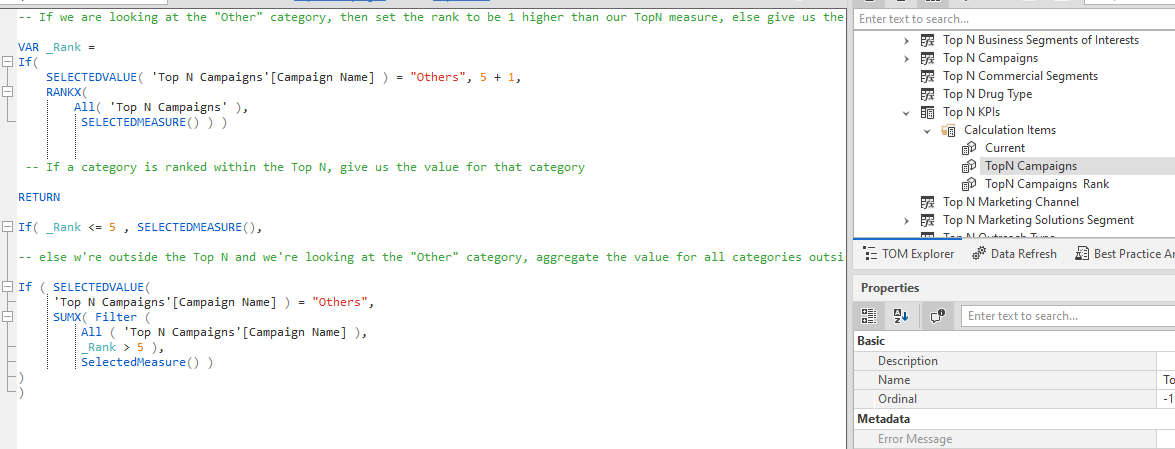
I am building Top N + Others and I want to replicate it in Tabular Editor. I have other measures and categories I want to use and don’t want to write numerous measures. But for some reason the visuals is not showing the Others category. I believe it is because I can’t place Tabular editor calculation items in the Tooltips.
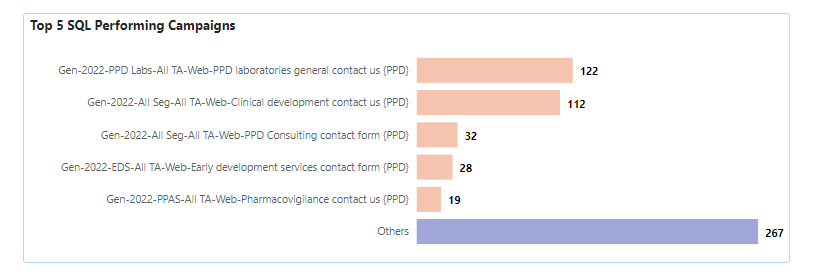
In image #1, is an example of the chart not using Tabular Editor.
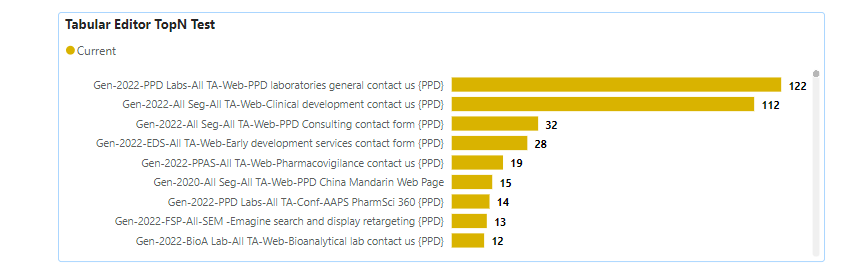
In Image #2, is an example using Tabular Editor
The Tabular Editor Calculation group is named Top N KPIs.
Thanks for your help in advance.
Best
WIP.pbix (17.3 MB)
1 Like
Hi @ysherriff,
Thanks you very much for post your query into the forum.
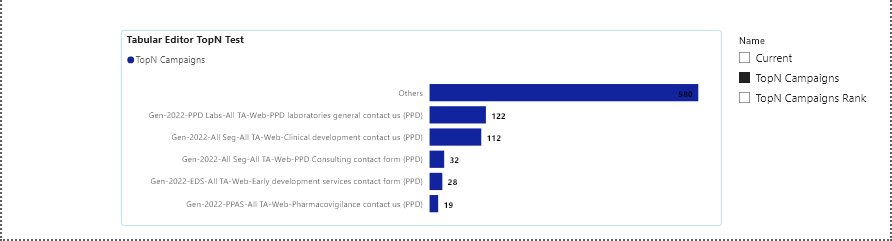
In image #2, we are applying the Name = Current filter, so the Others category has a value of 0.
You can filter by TopN Campaigns so that Others appears with the value of the rest of the categories with ranking > 5.
If you need the # of SQLs Campaigns measure to return 0 instead of BLANK, you can modify it as:
# of SQLs Campaigns =
VAR _Result = Calculate(
         [Total SQL's],
         CROSSFILTER(Campaigns[Contact ID],
          'Contacts Table'[Contact ID],
          Both )
)
RETURN _Result + 0
Regards,
WIP_JAFP.pbix (17.3 MB)
1 Like
Thank you very much Jafer. Much appreciated.
1 Like
Hi @ysherriff did the response provided by @jafernandezpuga help in solving your query?
If not, how far did you get, and what kind of help do you need further?
If yes, kindly mark the answer that solved your query as the SOLUTION. Thanks!
I hope that you are having a great experience using the Support Forum so far. Kindly take time to answer the Enterprise DNA Forum User Experience Survey, we hope you’ll give your insights on how we can further improve the Support forum. Thanks!