Dear sir/ madam,
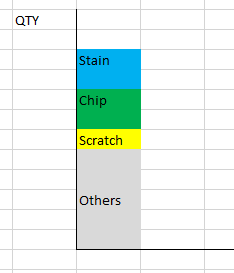
In Power BI, I am trying to create Top 3 Selection of defect types (in qty) and then combine the other defect types in “Others”.
I would also like to show the result in a column chart as shown in example below.
Please see file attached for the data.
Hi Ankit,
Thanks so much for the info.
The Youtube video was great and I was able to duplicate the solution.
I have a question about the Total values.
Please see below snippets of the Total between the 2 tables. (from the Youtube video)
The Totals were not able to match and I think some of the value was not calculated in “Others” even though the Top N values were matching.