Hi @lancemillercpa98.
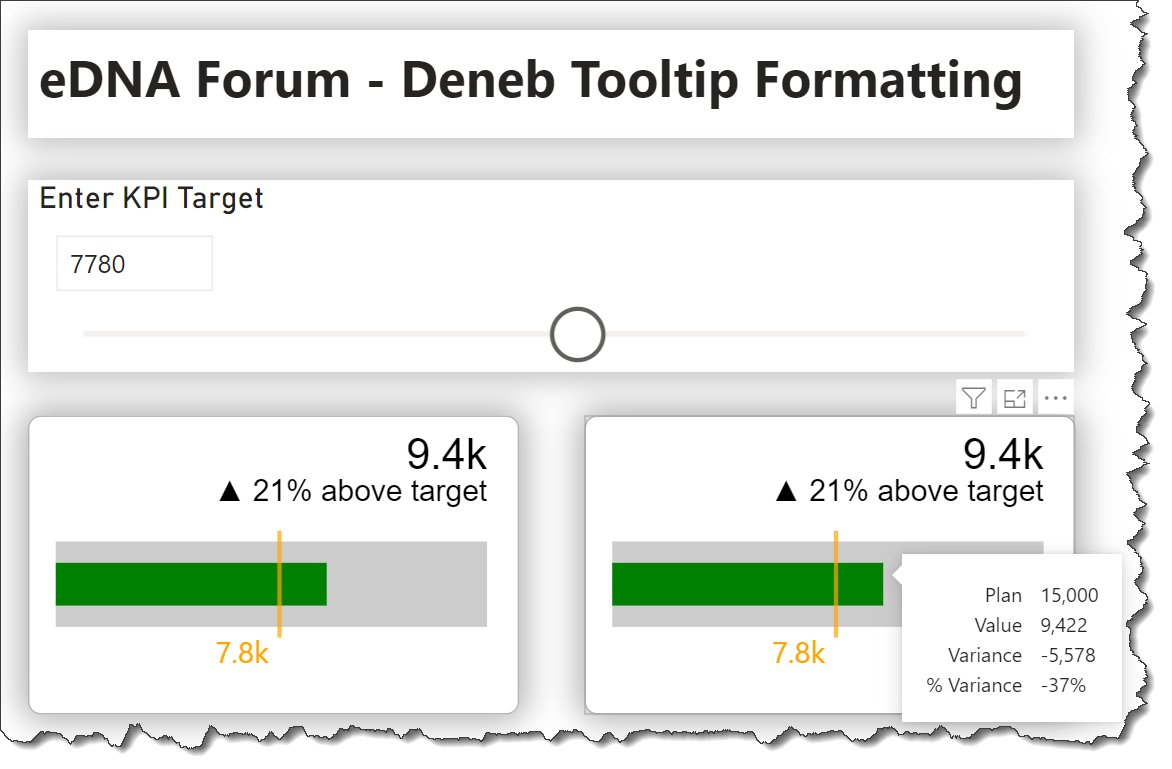
How’s this?
To implement, just add a tooltip block to the encoding block and reference the plan and value fields.
To perform in-visual calculations for the variance and % variance, add a transform block then expand the tooltip encoding block as desired.
{
  "data": {"name": "dataset"},
  "transform": [
    {
      "calculate": "datum['Value'] - datum['Plan']",
      "as": "_variance"
    },
    {
      "calculate": "datum['_variance'] / datum['Plan']",
      "as": "_percent_variance"
    }
  ],
  "encoding": {
    "x": {
      "type": "quantitative",
      "scale": {"nice": false},
      "title": null,
      "axis": null
    }
  },
  "layer": [
    {
      "mark": {
        "type": "bar",
        "color": "#ccc",
        "size": 40,
        "yOffset": 10,
        "tooltip": true
      },
      "encoding": {
        "x": {"field": "Plan"},
        "y": {
          "field": "",
          "title": null
        }
      }
    },
    {
      "mark": {
        "type": "bar",
        "size": 20,
        "yOffset": 10,
        "tooltip": true
      },
      "encoding": {
        "x": {
          "field": "Value",
          "title": null
        },
        "color": {
          "condition": [
            {
              "test": "datum['KPI'] === 2",
              "value": "red"
            },
            {
              "test": "datum['KPI'] === 1",
              "value": "yellow"
            },
            {
              "test": "datum['KPI'] === 0",
              "value": "black"
            }
          ],
          "value": "green"
        },
        "tooltip": [
          {
            "field": "Plan",
            "type": "quantitative",
            "formatType": "pbiFormat",
            "format": "#,#"
          },
          {
            "field": "Value",
            "type": "quantitative",
            "formatType": "pbiFormat",
            "format": "#,#"
          },
          {
            "field": "_variance",
            "type": "quantitative",
            "title": "Variance",
            "formatType": "pbiFormat",
            "format": "#,#"
          },
          {
            "field": "_percent_variance",
            "type": "quantitative",
            "title": "% Variance",
            "formatType": "pbiFormat",
            "format": "#%"
          }
        ]
      }
    },
    {
      "mark": {
        "type": "tick",
        "color": "orange",
        "size": 50,
        "yOffset": 10,
        "thickness": 2,
        "tooltip": true
      },
      "encoding": {
        "x": {
          "field": "KPITarget Value",
          "title": null
        }
      }
    },
    {
      "mark": {
        "type": "text",
        "color": "orange",
        "dx": -5,
        "dy": 0,
        "xOffset": 0,
        "yOffset": 50,
        "angle": 0,
        "align": "right",
        "baseline": "bottom",
        "fontSize": 14,
        "fontWeight": "normal",
        "limit": 0
      },
      "encoding": {
        "text": {
          "field": "KPITarget Value",
          "format": ".2s"
        },
        "x": {
          "field": "KPITarget Value",
          "type": "quantitative"
        }
      }
    },
    {
      "mark": {
        "type": "text",
        "dx": 0,
        "dy": 0,
        "xOffset": 0,
        "yOffset": -40,
        "angle": 0,
        "align": "right",
        "baseline": "bottom",
        "font": "sans-serif",
        "fontSize": 20,
        "fontStyle": "normal",
        "fontWeight": "normal",
        "limit": 0
      },
      "encoding": {
        "x": {
          "aggregate": "max",
          "field": "Plan",
          "type": "quantitative"
        },
        "text": {
          "field": "Actual",
          "format": ".2s"
        }
      }
    },
    {
      "mark": {
        "type": "text",
        "dx": 0,
        "dy": 0,
        "xOffset": 0,
        "yOffset": -40,
        "angle": 0,
        "align": "right",
        "baseline": "top",
        "font": "sans-serif",
        "fontSize": 14,
        "fontStyle": "normal",
        "fontWeight": "normal",
        "limit": 0
      },
      "encoding": {
        "x": {
          "aggregate": "max",
          "field": "Plan",
          "type": "quantitative"
        },
        "text": {
          "field": "Format Variance"
        }
      }
    }
  ]
}
Hope it helps.
Greg
eDNA Forum - Deneb Tooltip Formatting.pbix (2.5 MB)