Hi everyone,
I do need your help on the below topic
IN GENERAL : I create some charts on would like to have a personalised tooltip when I do click on the column of the chart showing the data set part of that column
THE ISSUE : I am able to show the tooltip with the desired fields, but for all dataset rows, instead of showing me the rows relevant to the highlighted column of the chart
THE PLAYGROUND FILE :
I here attached an extract f the PBIX I am working on and I do need your support
In the tab “Float” there is histogram chart “Total float distribution” (right below corner of the page) that is a histogram chart counting how many rows have the attribute “float” within a defined range
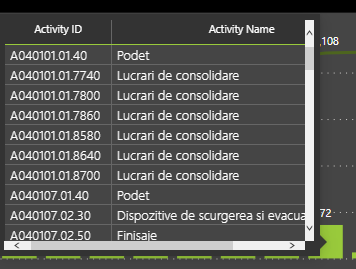
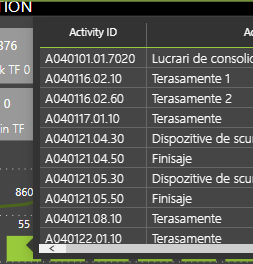
As tooltip I made a page with a table reporting two row attributes (Activity ID and Activity Description)
I connected the chart with the tooltip page just created and when I hover above the histogram bar I got the table tooltip, BUT does show me all the table rows instead of just the selection of the rows belonging to the highlighted column
I am getting ready to go into a meeting, so don’t have time to play with your sample yet - but the first thing that occurs to me is a mistake I made when trying to set up a tooltip.
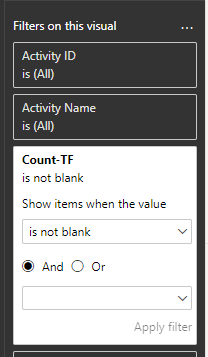
Do you have a measure on the tooltip visual (not the one on your Float tab, the one that is the tooltip) - that will allow it to filter to the metric used in your histogram chart? Often I just use the same measure - that is on the original table (in this case the histogram)
If this has not helped you by the time I can look at things again later today, I’ll look at your file at that time to see if I can provide additional info.
Just following up if the response above help you solve your inquiry.
If it did, please mark his answer as the SOLUTION.
We’ve noticed that no response was received from you on the post above. In case there won’t be any activity on it in the next few days, we’ll be tagging this post as Solved.
I do understood that what I was looking is not possible, need to use a different approach
I may use still a tooltip page with the detail of the activities but a slider to choose the one withthe the desired Total Float Range