I have a topojson map of postal code regions in Switzerland for use with shapemap visual. There are 4133 regions at 4-digit postal code level which is most detailed level in Switzerland. The file contains the postal code of each region so that Power BI can reference data correctly to the visual.
Now I want to create two additional shapemaps (meaning: two separate topojson files), one that combines regions on 2-digit postal code level and one that combines regions on 1-digit postal code level.
An additional use case will be to create a third topojson file that combines postal code regions into sales regions of my customer. So the input for combining the shapemap regions will be a list with postal codes in one column and sales regions in the second column. If you have a solution for that, the two maps above can be created as special cases of this third use case.
Is there a tool or proceeding that you can recommend for doing that?
Hi,
So eventually you will be building sales territories on either 4, 2 or 1 digit postcode.
I have not tried this in Power BI yet, for building shapefiles I use a GIS application, Maptitude, offering a DACH map with their product, and mapshaper to get the json file.
Probably you can work with MapBox to do something like this as well.
Just to make sure I inderstand your question, pls see attached pbix. Is this in your line of thinking. Dyn Territories Shape Map NZ V2.pbix (108.1 KB)
Paul
Hi @Paul,
you’re amazing, you even prepared a file for me!
Indeed I must admit that there was some room for missunderstanding in my description. You do the grouping of the territories dynamically in Power BI. I like the idea, but that’s not what I need. I want to combine the shapes in the map before I load it into Power BI. In your scenario 1, for example, all 4 yellow shapes should be merged into one shape before I load the json map into Power BI.
I’m looking for a tool that can do this kind of programmatically, so that I can use as an input my map and a list like this, e.g. a csv file:
ZIP-code,salesperson
1000,Salesperson A
1001,Salesperson A
1003,Salesperson A
1005,Salesperson B
…
Then all territories of salesperson A should be merged into one shape and so on. The reason is that we have 4000+ zip codes, so I have 4000+ shapes which takes a noticable amount of time to load. And in urban areas, just the shape boarders make the screen pretty cramped already. On the other hand I only have 10 sales territories, so I would have 10 shapes instead of 4133. The composition of the sales territory changes rarely so it’s OK to just load a new map in case, especially with a supportive tool to build the map Be aware that the sales territories are not an exact 1-digit or 2-digit split of the ZIP code range, the input must be as flexible as the list that I described. And I’m not looking for a tool where I have to click on each shape that I want to merge manually and then click a merge button. That’s hundreds of shapes, and I don’t want to pick a wrong one as well.
I had a look at a freeware tool called QGIS. It comes without maps, but it basically seems to support my use case - after learning deep enough how it works. I’ll have a look at your tools Maptitude and MapBox as well.
Best regards,
Martin
ok, in that case I suggest to look for a GIS tool, like QGIS or in my case Maptitude. Building territories in GIS allows for balancing the sales territories for distance, density, revenue etc. Create a few scenarios, convert to json and import in PBI. Mapbox is great for visualisation and free as well, get your json file, import into Mapbox Studio, free and easy, and create your layer. I am sure this can be done with ESRI as well but never used it other than the PBI visual.
Paul
Hi,
Did some more digging on this. You may find that postcode layers in GIS software cannot be exported, commercial aspects, so check that. You mentioned you had a shapefile, could you share it, so I can check it. I downloaded a postcode shapefile from a swiss website to find that the socalled datum of the map is not wgs84, meaning that your shapes may be projected somewhere else on the European map. I assume you have tested the shapes already in power bi?
Paul
Hi @Paul,
I think I found the same map as you with the same problem In QGIS I could map it to WGS84 after loading a WGS84 world map in the background and then only exporting the Switzerland layer. As you say, my Switzerland has an offset to Germany in QGIS, but it works for using Switzerland alone in Power BI. Schweiz-PLZ.json (668.2 KB)
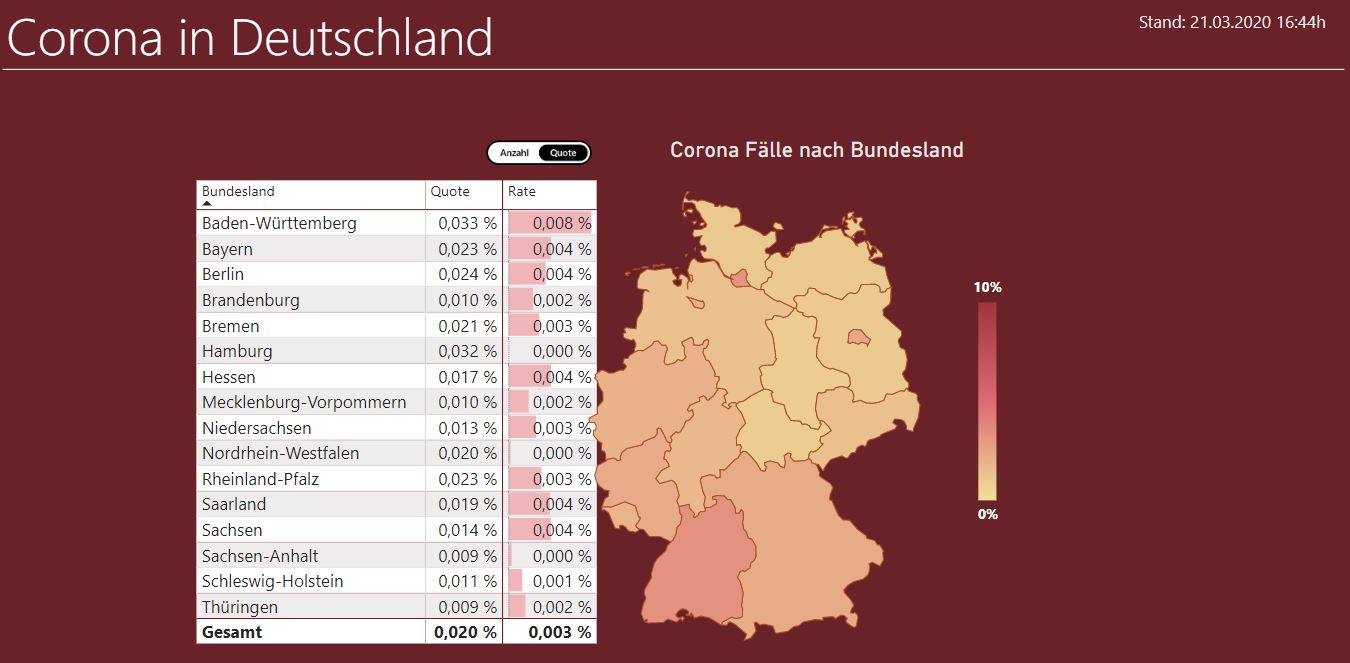
On Friday a colleague showed me what Qlik Sense - a competitor of Power BI - can do out of the box with regards to maps visualization, and it’s amazing compared with Power BI! Not only that all the shapes are included, you can control everything with data in a single visual: Color, opacity, show a colour gradient with the scale, you can even superimpose pie charts per shape/region - something I didn’t even dream of yet with Power BI. You can fake some of this in Power BI, as shown in the screenshot, but it’s a whole lot of manual work compared with Qlik.
Thanks for the file.
I worked with Qlik and Tableau, at some point many years ago, I have decided to go for Power BI, admittedly because I use GIS software next to it and mapping was poor in all three at the time. Hence I am not fully aware of the mapping capabilities in Q and T today, but I am very happy with Power BI, so would not change because of it. I am sure Microsoft will continue to develop and their cooperation with ESRI and Mapbox goes to show.
Paul
 Be aware that the sales territories are not an exact 1-digit or 2-digit split of the ZIP code range, the input must be as flexible as the list that I described. And I’m not looking for a tool where I have to click on each shape that I want to merge manually and then click a merge button. That’s hundreds of shapes, and I don’t want to pick a wrong one as well.