Time comparison over different fiscal years and periods

Dear,

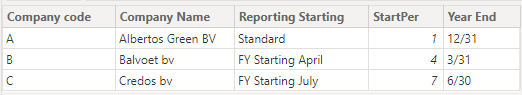
My report consists of accounting data for multiple companies with varying fiscal year-ends and fiscal periods (e.g. 4-period year => quarterly basis, 12-period year => monthly basis).

I am struggling to calculate the previous year amounts accurately as a result of the aforementioned differences in years and periods.

An important starting point where my judgment could already be flawed is that I thought it would not be possible to work with a ‘Date table’ given the wide variety of fiscal years/periods across a large number of companies included in the data (it is key that the top filter is company-based in order for the data to not get mixed up).

Currently I have defined a ‘Period ID’ (i.e. combination of client number + fiscal year + fiscal period) which is linked from a dim table (‘Client periods’ => extract of the general ledger fact table) to the fact table (‘General Ledger’) in a standard 1 to many relationship.
This works perfectly for the current year amounts.

For the previous year amounts, I created a ‘Period ID LY’ (i.e. combination of client number + fiscal year - 1 + fiscal period) which is also linked from the dim table (‘Client periods’) to the fact table (‘General Ledger’) in a standard 1 to many inactive relationship (Dim Client Periods - ‘Period ID LY’ => Fact General Ledger - ‘Period ID’).
In the previous year measure I simply use this inactive relationship to calculate the previous year amounts.

This all works fine as long as all periods across fiscal years remain the same (e.g. fiscal year 2022, period 4 => 2022-4 = 2021-4 => OK)
however when changes occur, the results are rendered useless (e.g. transition from quarterly periods in 2021 to monthly periods in 2022. fiscal year 2022, period 3 (i.e. March) => (Period ID) 2022-3 <> (Period ID LY) 2021-3 (i.e. July - September) => not OK).

Additional sidenotes:

  1. The date field of the general ledger (i.e. recording date) cannot be used since invoices of last year could be included in current year. As a result only the fiscal periods form a reliable basis in determining the correct amounts.
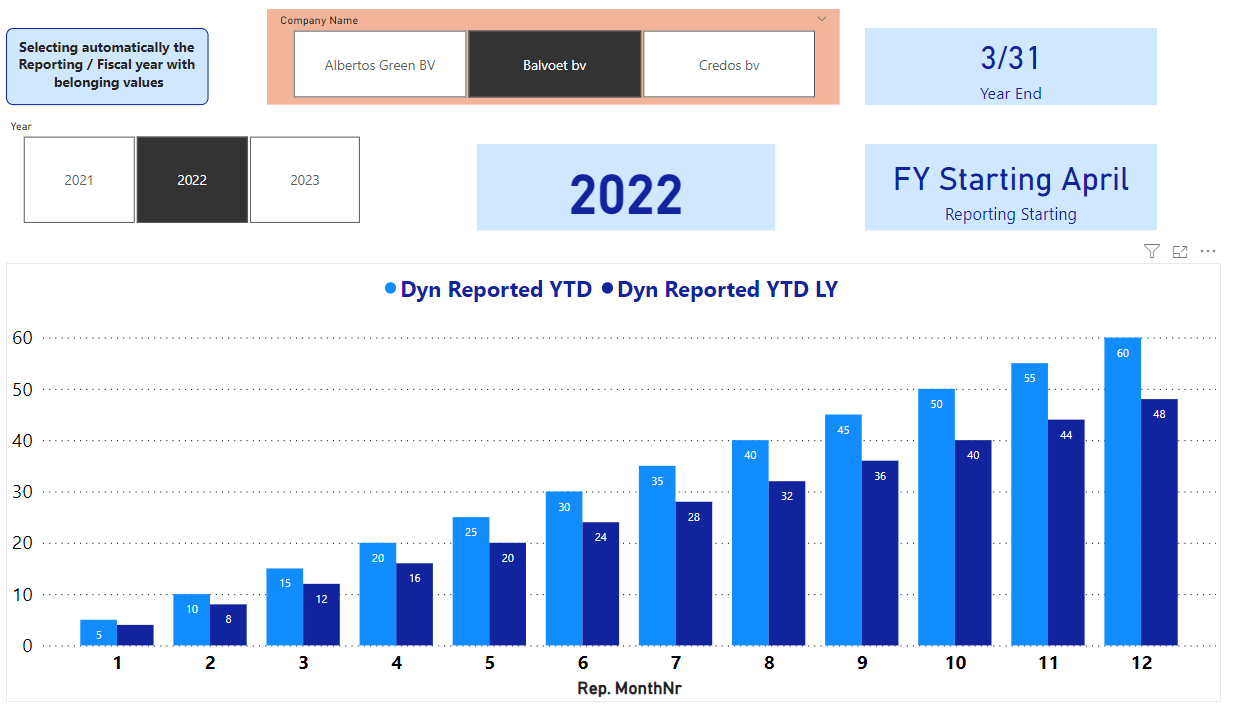
  2. The current slicer on the report page uses periods instead of dates and therefore only includes 4 items when the fiscal year consists of 4 periods. I like this approach since using a date field in the slicer would imply a full date range which could be confusing for users.
  3. The fiscal year slicer consists of the fiscal years included in the Dim table ‘Client periods’ and is therefore limited to the fiscal years applicable for the selected company. To my knowledge, including the ‘Year’ of a date table would imply that all years included in the date table are included in the slicer as well and therefore return years for which no data is available.

Do you see any other way to calculate the previous year amounts accurately? (both for each period separately and cumulatively)

Thank you for your time.

Financial reporting - Periods.pbix (489.3 KB)

The measue in which the last year amount is calculated is: ‘IS Actuals LY’

Bumping this post for more visibility from our experts and users.

Goodevening @Howard

First welcome to the forum !
Challenging problem presented.

When using time intelligence functions, the first condition is using a (complete) Date table to let all functions work properly.

Concept shared of automatic monthly dynamic company reporting:
Different reporting periods v4.pbix (103.7 KB)

I would like to share a concept of an automatic dynamic company reporting, taking into account different starting months of the year, by using an extended company master date table and the standard functions TOTALYTD and DATEADD.
In my opinion, this concept could be implemented and make the financial reporting more dynamic, however the 4/4/5 reporting is (yet) out of scope.

Workout explained :

  1. (Dummy) “grootboek”-data with their actual transaction dates, a standard date table and an extended company master data table, see below.

    image

    Note: be aware the “Year End” has to be text as shown to let it work.

  2. Define with TOTALYTD the YTD values based upon varying Year End reporting possibilities (month-based. 12 variations possible).
    With this formula for “Balvoet bv” the full YTD value will be reached in March each year.

Reported YTD = 
Var LastDatFY = SELECTEDVALUE(CompanyT2[Year End],"12/31") //when multiple companies or company without end reporting date
Return 
SWITCH( TRUE(),
        LastDatFY = "12/31", TOTALYTD( SUM(GrootboekT[Bedrag]),DateT[Date], ALL(DateT), "12/31"), // Normal 
        LastDatFY = "3/31", TOTALYTD( SUM(GrootboekT[Bedrag]),DateT[Date], ALL(DateT), "3/31"),   // FY starting in April
        LastDatFY = "6/30", TOTALYTD( SUM(GrootboekT[Bedrag]),DateT[Date], ALL(DateT), "6/30"),   //  FY starting in July
        LastDatFY = "7/31", TOTALYTD( SUM(GrootboekT[Bedrag]),DateT[Date], ALL(DateT), "7/31"),   //  FY starting in Aug
        0)

Note: adding the variable “LastDatFY” to the formula TotalYTD does not work, it has to be done with Switch True()

  1. The dynamic concept is thought to use only the month number in the X-axis, which are fixed from 1 to 12, in combination with to move the YTD and period values with a DATEADD function according the company master data “StartPer”
    In fact this results in reporting the Fiscal Year with values in the Fiscal months (cq Reporting months)
Dyn Reported YTD = 
Var StartPeriod = SELECTEDVALUE( CompanyT2[StartPer],1) - 1  // if no starting period within Company table, then standard period, starting in Jannuary.(no dateadd needed!)
return
CALCULATE( [Reported YTD], DATEADD(DateT[Date],StartPeriod,MONTH))

Notes:

  1. Be aware that the X-axis has to be numeric, with the periods 1-12, to see the FY-reporting.
  2. Step 2 and 3 are done similarly for Period, and could be done likewise for QTD
  3. Not tested on performance within large datasets.
  4. Last Year is calculated with measure branching and DateAdd:
Dyn Reported Period LY = CALCULATE( [Dyn Reported Period], DATEADD( DateT[Date], -1, YEAR))

A dynamic graph can be made as a result:

Hopefully this helps you further,
Kind regards, Delta Select

1 Like

Hello @Howard

Did the responses above help solve your query?

If not, can you let us know where you’re stuck and what additional assistance you need?

If it did, please mark the answer as the SOLUTION by clicking the three dots beside Reply and then tick the check box beside SOLUTION

Thank you

Hello @deltaselect,

Thank you for your clear and valuable insights!
The concept of dynamic company reporting is very interesting and relevant in this case.

This will indeed make the reporting more dynamic.

Kind regards,
Howard