Time allocation across months

Hi

Herewith:

  • A solution to an error on the occupancy pbix
  • Two questions

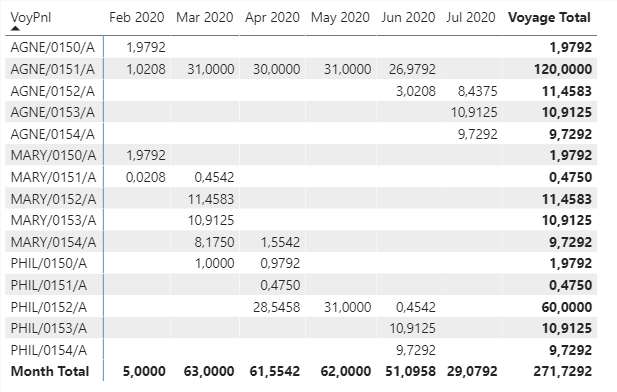
The occupancy pbix (https://portal.enterprisedna.co/courses/305944/lectures/10836917) has an error in that where a bed is occupied for a whole month, the number of days in the month is off by one (e.g May has 31 days not 30). My problem is the same swapping ships for patients: the voyage of a ship has a start datetime and an end datetime and the requirement is to pro-rate/allocate the days into each month bucket. Using Occupancy.pbix, the occupancy measure gave me a starting point which I edited basis a VB formula I knew to work. The result is attached which gives the correct allocation.

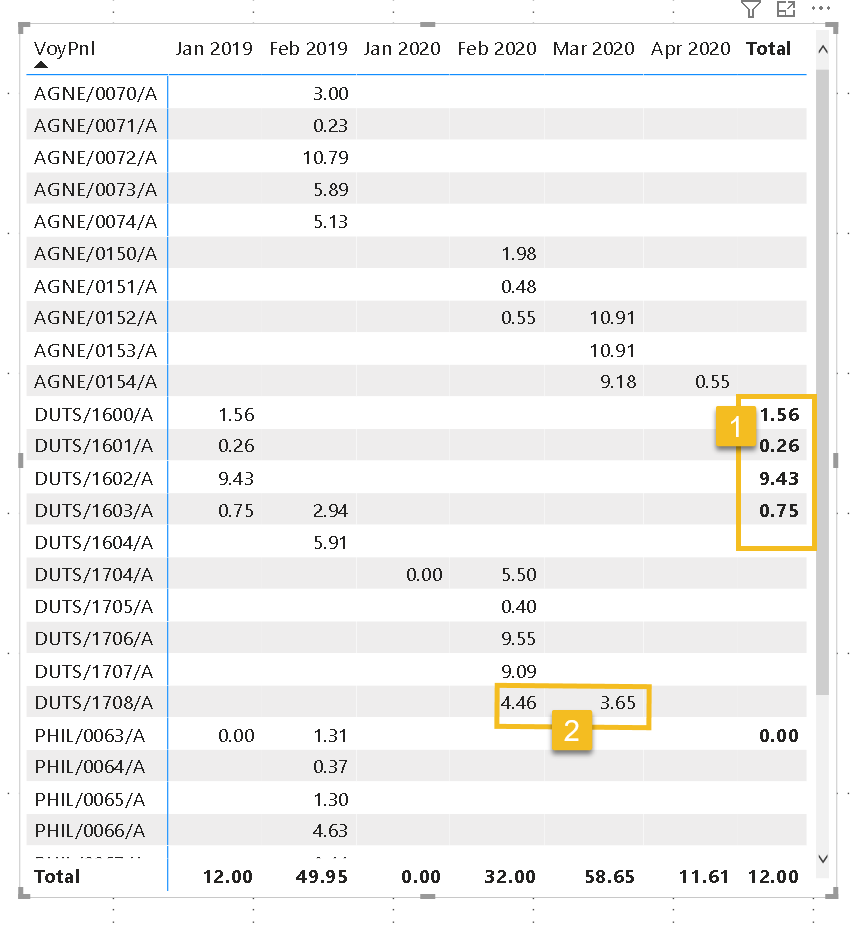
Q1 Why can I not get row totals to appear in the matrix ??

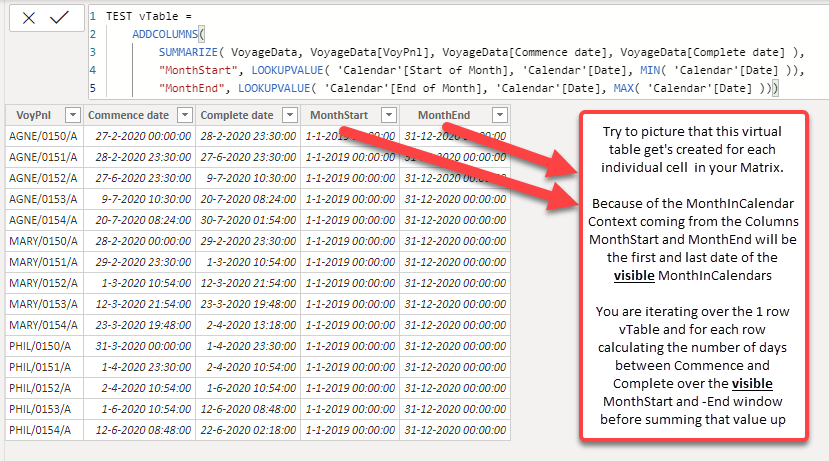
Q2 This is more fundamental – the matrix shows the correct numbers, but what is making PowerBI iterate across the months. In my VB code, I had a for loop stepping through month by month.

Regards
Nick

PS The courses are really great for content, presentation and length !!
Time allocation.pbix (159.1 KB)

Hi @Nickj,

Q1. because there is no context for those dimensions present in the total row

Q2. the Calendar[Date] is linked to the MonthInCalendar through your Date table.
.

So I changed your Date table, adding both “Start of Month” and “End of Month” Columns

Next created this measure.

Days in Month v2 = 
VAR vTable = 
    ADDCOLUMNS(
        SUMMARIZE( VoyageData, VoyageData[VoyPnl], VoyageData[Commence date], VoyageData[Complete date] ),
        "MonthStart", LOOKUPVALUE( 'Calendar'[Start of Month], 'Calendar'[Date], MIN( 'Calendar'[Date] ) ),
        "MonthEnd", LOOKUPVALUE( 'Calendar'[End of Month], 'Calendar'[Date], MAX( 'Calendar'[Date] )))
RETURN

SUMX( vTable,
    VALUE(
        IF( (MIN ([MonthEnd] + 1, [Complete date]) - MAX([Commence date], [MonthStart])) < 0, 
        BLANK(), 
        (MIN ([MonthEnd] + 1, [Complete date]) - MAX([Commence date], [MonthStart]))
    ))
)

.
With this result.
image
.

I hope this is helpful.

Hello Melissa,

Indeed it is and thank you so much for such a quick reply. I see you are creating a temporary column, then calculating on that - this is some steep learning curve :slight_smile: !

In the picture :

  • point 1 - some voyages are getting totals but only some which is weird and then only for the first month entry
  • point 2 - when I transferred the measure to a more real model I found that only one month was filled in for any particular voyage and the difference was that I had a relationship between the calendar and the voyage commence date, removing this gives the correct entries in multiple months where relevant.

Regards
Nick

Did you add the “Start of Month” and “End of Month” Columns to your Date table??
I have no relationship between Calendar and VoyageDate

Here’s my sample file.
eDNA - Time allocation.pbix (140.8 KB)

No I do not have Start of Month nor End of month in the date table. Should I / is that better?

I had VAR MonthStart = EOMONTH(VALUE(MIN( Calendar[Date])), -1) + 1
and VAR MonthEnd = EOMONTH(MonthStart,0) to give these.

Date relationship

  • It was having a relationship from Date in the date table to Commence date that broke the calculation

In this case yes, we need that context from the Date table - it’s a quick fix as depicted just make sure your Calendar[Date] column is selected and go to Add Column/Date/Month/

So you’ve also had to modify the [Days in Month v2] measure, please revert back to the version above

Will do. Fyi I copied and Pasted your v2 into my model & it worked without adding the Start month, End Month but keeping the EOMonth stuff - yours is simpler though and likely has future use too.

Thank you for your help in this, please mark the ticket as Solved. I am moving on to using the month allocation numbers in a budget :slight_smile:

Cheers
Nick

Glad I could help.

Good luck with your project!

Hello Melissa,

I am carrying on with my project but I have two items I want to really understand for the future and I am struggling with:

a. In using the ‘Days in Month v2’ measure, what is it that makes Power bi iterate through all the months to give the correct month by month values we see in e.g. AGNE/0151/A ? Sumx is an iterating function and the vTable has one row for each voyage with the min and max dates in the calendar so it is not like there is a row per Voyage/Month number combined … ?

b. If I now add a 1:many relationship from Date in Calendar to CommenceDMY in VoyageData (just the day, month and year of the commence datetime column), then this breaks the measure and only the first month’s value are shown ( this may be clear after understanding a.)

With thanks
Nick
eDNA - Time allocation v2.pbix (141.8 KB)


Where it shows 1/1/2019…31/12/2020 for Feb 2020 it creates a window of 1/2/2020…29/2/2020, next it calculates the number of days for each row according to your logic before summing that value up

VALUE(
    IF( (MIN ([MonthEnd] + 1, [Complete date]) - MAX([Commence date], [MonthStart])) < 0, 
    BLANK(), 
    (MIN ([MonthEnd] + 1, [Complete date]) - MAX([Commence date], [MonthStart]))
))

.

Correct. That relationship creates filtering.

When you have multiple dates in your fact table and you want them to be treated equally inside DAX calculations there are 2 options, no relationship OR all inactive relationships.
And when you need to calculate something over a specific date in your fact table then you create that relationship virtually using TREATAS or in the second case by activating the relationship with USERELATIONSHIP.

I hope this is helpful.

Ahh so because the report has the MonthInCalendar columns this results in the calculation being executed independently for each column and hence for each voyage/month start/end date combination …

Well you could also use another granularity from your Date dimension like QuarterInCalendar or Year.
Because the MonthStart and MonthEnd columns are calculated on the highest granularity. that of Date

Light dawns, Many thanks, Nick

Hello again Melissa,

In the attached pbix, I have the formula working but I really want to understand why. With the v5 measure, adding a relationship from Dates to Voyages breaks the calc. For V7, since Voypnl is unique, I did not see the need for the Summarize line and after some googling, I have added the Calculate and Crossjoin lines. This version works too with or without a relationship from the Dates tables to the voyage table and I understand that this is because Crossjoin is effectively switching off the relationship making the v5 and v7 calculations the same.

The question is why does the relationship break the calculation?

With thanks & regards
Nick

Time allocation v2.pbix (121.2 KB)

Days in Month v5 =
VAR vTable =
ADDCOLUMNS(
SUMMARIZE( ‘Voy dates’, ‘Voy dates’[VoyPnl], ‘Voy dates’[Commence date], ‘Voy dates’[Complete date] ),
“MonthStart”, LOOKUPVALUE( ‘Dates’[Start Of Month], ‘Dates’[Date], MIN( ‘Dates’[Date] ) ),
“MonthEnd”, LOOKUPVALUE( ‘Dates’[End Of Month], ‘Dates’[Date], MAX( ‘Dates’[Date] )))
RETURN

SUMX( vTable,
VALUE(
IF( (MIN ([MonthEnd] + 1, [Complete date]) - MAX([Commence date], [MonthStart])) < 0,
BLANK(),
(MIN ([MonthEnd] + 1, [Complete date]) - MAX([Commence date], [MonthStart]))
))
)

Days in Month v7 =
CALCULATE(
SUMX(‘Voy dates’,
VALUE(
IF( (MIN (MAX(Dates[Date]) + 1, [Complete date]) - MAX([Commence date], MIN(Dates[Date]))) < 0,
BLANK(),
(MIN (MAX(Dates[Date]) + 1, [Complete date]) - MAX([Commence date],MIN(Dates[Date])))
))
),CROSSFILTER(Dates[Date], ‘Voy dates’[CommenceDMY],None)
)

Oops I meant Crossfilter where I said Crossjoin :frowning:

The relationship breaks the v5 calculation because the Voyages table gets filtered by the Dates table (context coming from the column section in your matrix), making it only visible in the CommenceDMY period in the Dates table.

Exactly why you use CROSSFILTER to override the existing cross-filtering setting in v7 basically…

Finally I get it. And with the relation removed/switched off, all time is considered giving the correct result.

Much appreciate your patience, thanks again, Nick