Hi All,
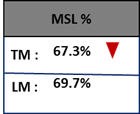
I have a KPI Called MSL. I want to compare This Month ™ with Last Month (LM) with percentage change and want to show the visual as below.

Please help
regards
Hi All,
I have a KPI Called MSL. I want to compare This Month ™ with Last Month (LM) with percentage change and want to show the visual as below.

Please help
regards
Hi, just need to be a bit more descriptive here.
What current DAX formula as you using? What do the model look like? Where is that visual from?
Just need to add as much colour as possible, as it’s not just that simple.
Thanks