Hi, I have one promotion product table, and one Fact table. I need to calculate the Basket sales of the orders that contain the promotion products (not the product sales). For example, if one order contains promotion product A (sales of $20) and non-promotion product ($50), the total basket sales for this order is $70.
Could you please help me to understand how to calculate the basket sales of orders that contain promotion products?
I’m unsure what you are expecting here AND I have some concerns about your model.
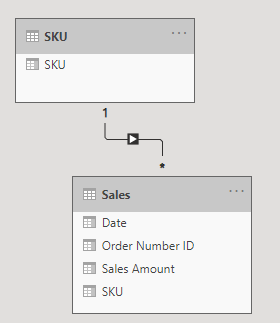
You have a SKU Dimension table which doesn’t include all SKU’s present in Sales
You don’t have a “Promotion product table” in the model
Even though you aren’t performing Time Intelligence calculations at this time, your Sales table includes a Date field - so as a best practice you need to include a Date Dimension table as well and mark that as a Date table
So review your question and provide additional details, preferably with a mock up of the expected result AND an updated model.
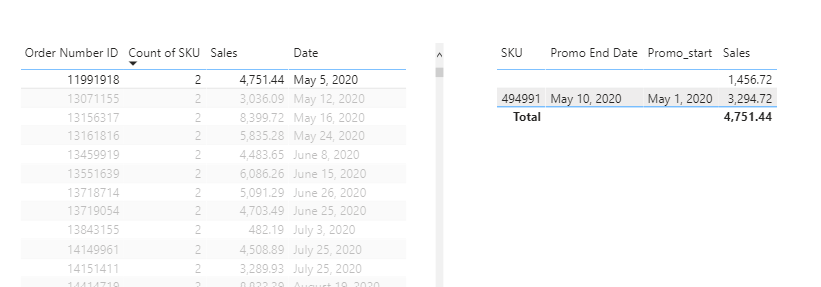
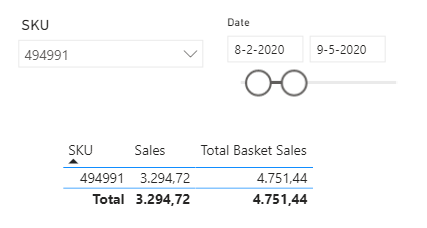
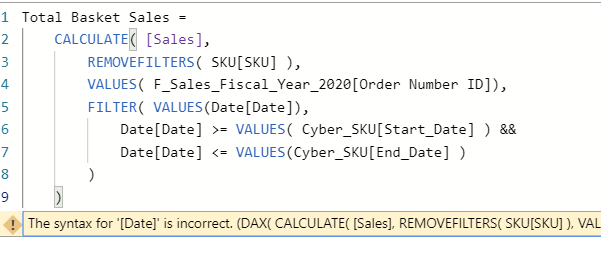
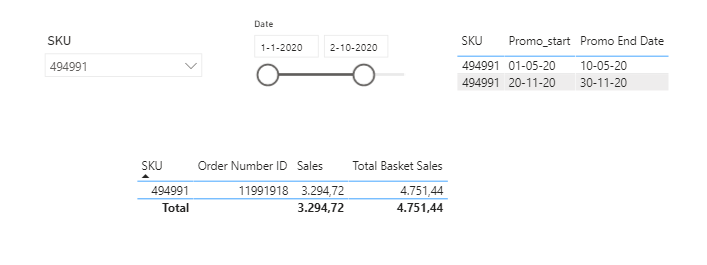
@Melissa thanks. I have updated the file. The SKU table actually should be the promotion SKU table. I also added Date table. The Fact table might not have all the SKU in Promotion SKU table because one Promotion SKU might not have sales. On the Promo SKU table, I also added Promo Start Date and Promo End Date. Is it possible to find out the Basket sales of orders that contain promo SKU during the campaign period? For example, SKU 494991 was on promotion from May 1 to May 10, the order 11991918 contains this SKU and I’d like to get the total basket sales of 4751.44.
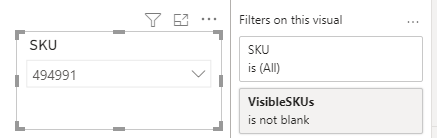
@Melissa thanks for your time and help, that is awesome. I checked your file and saw one column called 'VisibleSKU", could you please help me understand the purpose of this column?
It’s not a column but a Measure that I used on the SKU slicer (check out the filter pane) it filters down to only SKU’s that are present in the Promo SKU table.
Need is a big word but remember I changed your model so the SKU dimension table now includes all SKU’s from both Promo and Sales. In your original file you had the Promo SKU field in the Slicer so excluding all SKU’s only present in Sales.
Now the SKU dimension field is placed in the Slicer so including also all SKU’s present in Sales and the measure ensures that you can only see and select an item if that’s present in the Promo SKU table, like you had previously but sure you can remove it if you don’t want/need it.
@Melissa hi, Melissa, just have one quick question for you. What if in my promotion SKU have duplicate SKU, for example, one SKU could have multiple promotion during a year. Do you know if this method will still work? Thanks in advance!
Can you provide a new sample PBIX, so I can review the model as is and incl. duplicates?
There is another issue with the measure I provided so I’ll address that as well then…
@Melissa, Hi, Melissa, I have updated the promotion SKU list and Sales table, please see the attachment. Thank you for your help! Really appreciate it!
@Melissa HI, Melissa, I tested it and it is working as I expected. That is awesome. Thank you very much. One question, with this data model, do you know if it is possible to calculate the sales of promotion SKU prior to campaign start date? for example, if a campaign starts at May 20, 2020 (campaign start date and end date will be in the promotion SKU table), when select this campaign on the visual, is it possible to have a measure to show the sales of the campaign SKU 4 weeks prior to the campaign?