This is an excellent example of creating a true Pareto test pbix but in addition I’m wanting to list out the 20% & 80% customer names per selection state and I’m not having any success figuring that out.
Yes that’s an interesting one. Let me work up an example and come back
Couple of steps to this one, but logic not too difficult.
Key is to just get a few intermediary calcs arrange.
Here’s the last formula which retrieves the sales of only the top 20% of customers. This is dynamic based on the state selected and time frame also.
Top 20% Customer =
IF( ISBLANK( [Total Sales] ),
    BLANK(),
        IF( RANKX( ALL( Customers ), [Total Sales], , DESC ) < ( CALCULATE( [Unique Customers], ALL( Customers ) ) * 0.2 ),
            [Total Sales],
                BLANK() ) )

The main part of the formula is this
IF( RANKX( ALL( Customers ), [Total Sales], , DESC ) < ( CALCULATE( [Unique Customers], ALL( Customers ) ) * 0.2 ),
The logic reads if the customer rank is less than the 20th percentile rank number then return sales.
Hopefully this makes sense
Thanks Sam but not quite fully understanding and I think its because I don’t understand what the [Unique Customers] measure looks like?
The solution is what I’m looking to get and by having this working pattern the user could duplicate the table and then filter Top 20% two different ways to yield only the top 20% in one table and the bottom 80% in another table.
What’s nice about this Pareto approach is that the 20% group can be a very large set and not a problem whereas in other examples the 20% is usually a very small number and just by looking graphically you can guess at what might be the 20% like 2 in 10 for example.
Sorry the unique customer formula is just working out the denominator of the calculation.
It is DISCOUNTCOUNT( Sales[Customer ID] )
So, based on any time frame selection it is working out how many customers purchased anything.
To work out 20% of customers, I then went -> Unique Customers * 0.2
Yes as you mentioned, you can change the logic slightly and get the 80% also.
Chrs
Yes works great. Thanks Sam!
Sam,
Just watched the follow up video.
Am I right to understand that this will not dynamically calculate 20% of Total Sales and the names of the customers within the scope, but 20% of the Top 20 Customer’s Total Sales, which is not the same thing.
Paul
![]()
You mean this tutorial - https://www.youtube.com/watch?v=jyKAxKSHBTk
This one is solving what Dave asked above in this post, where you want to just drill into the top 20% of customers and what their sales are for the individual people.
To work out the total of 20% would need some slight adjustments but can be done.
Yes, that is clear and works fine. As an addition to a Pareto analysis I choose to add information to show the Top 3, Top 5 and Top 10 customers and other ranking items such as Shipments and Weight. See summary dashboard to showcase this.
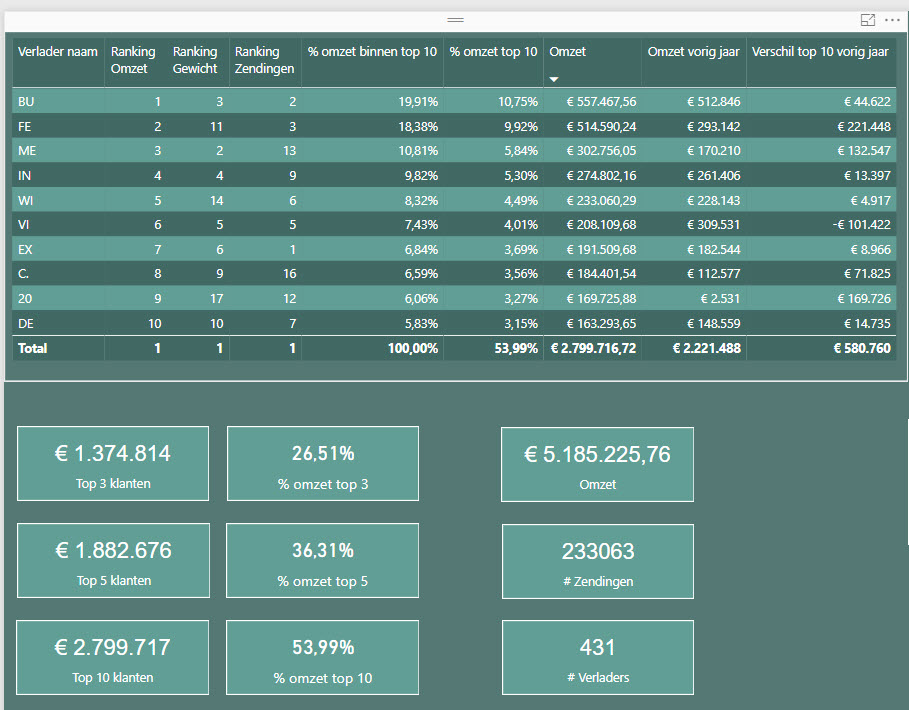
Paul
![]()
Nice, looks great.