How can I calculate incentive on the basis of volume achieved and targets?
My targets and volume are in different tables, I’ve derived a % increase or decrease from it.
Now I want to calculate Incentive Payout on the basis of achievement, I’ve another data set which only includes achievement and payout %(as shown below).
Attainment
Payout
79%
0%
80%
70%
90%
85%
100%
100%
110%
115%
125%
135%
150%
160%
200%
220%
250%
300%
300%
380%
400%
495%
500%
1000%
Now I want to multiply the attainment% by payout%. The payout amount is fixed at 90,000.
So ideally if attainment is 80% then 90,000 * 70/100 and so on.
First thing I would do is merge all of your TARGETS tables into one like the file I have attached. This will make it much easier for you to setup measures. You will also see where I added a Target Date column to help distinguish what month it is. Incorporate this into your model and have a go at it. If you get stuck, let us know here on the forum and we will assist.
** You are more than likely going to use a SWITCH statement to accomplish your solution above**
Here is a video from Sam, in case you are not familiar with the logic
Hi,
You beat me to it
Yes, I agree. Many ways to achieve this.
Another solution would be to enter this table in Enter Data, adding a min bin column , with Attainment being the max column and Payout the value column. The classification this way also allows to create a slicer to filter on the individual bins.
Thanks for your insights I did combined that table and assigned dates to the targets as well.
But I’ve assigned the month end date, so do you think this would be causing issue in my calculation as I’m not getting correct targets for all the SM.
Please keep the Dates the way I had them. You need the 1st of the month, not end of the month if I’m understanding your last post. Once you have this complete, post an updated version of you PBIX.
I’ve tried doing it 1st of the month as well. But still facing the same issue.
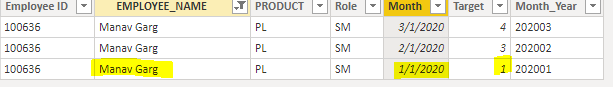
For Manav, Target should be 1 for Jan. But I’m getting 3 only which is the target for Feb.
Thanks for your prompt checking of results. Yes, with combination of EOMONTH and TODAY function, it would have given you static value for particular month in that case.
One other thing I would do is setup a proper Calendar Table. I noticed that the Months and Month and Year Columns did not sort correctly. Sam has a great way to setup a proper Calendar Table. Here is a video and document for you to copy and paste into the Query Editor.
** The second document that includes offsets is something you can use as well that I picked up from @Melissa here in the forum**
Hi JarrettM,
Please I need a solution to the use of Date table.
I work where we use October as FY start month therefore using the date table I will use FY Start Month as 10. However January, February, March still comes as Q1 instead of Q2 for my organisation (Oct/Nov/Dec is Q1).
How can I achieve this?
Secondly, lets say I have a set target of HIV test of 1000 from Oct 2021 to September 2022. As at June 2022 we have achieved 700 (70%) remaining 300 (30%) to be achieved in Jul/Aug/Sept (i.e Q4). How can I calculate the following and have it show up on timeline bar on my dashboard.
300 to be recalibrated across the 3 months to show daily (300/no of remaining days),
weekly(300/no of remaining week) and monthly target (300/no of remaining Month).
Display the number of remaining days, week, months to end the FY