Switch function using % not showing in order

Hi All,

Hoping there is a quick solution here. I have the below DAX function to switch between different measures and a a date slicer. The issue I am having is the the % values are not showing in numeric order.

SwitchAcc =
VAR SelectedSwitchAccount = MIN(‘Metric Selection’[Metric Index])
RETURN
SWITCH(
SelectedSwitchAccount,
1, [Total Sales $],
2, [Total Cost],
3, [Total Gross Profit],
4, FORMAT([Profit Margin %],“Percent”)

Returning the below.
image

Can anyone help? Thanks.

Hello @Nurry90,

Thank You for posting your query onto the Forum.

Firstly, please always try and upload either the working or the demo PBIX file for the reference purposes so that members of the forum can provide assistance in a better and efficient manner without which it just involves the guessing work and consumes more of their time.

Now, since your measure contains the usage of the “FORMAT()” function. This function converts the numericals into the Text format. Still by using the same logic as you’ve showcased in your measure, I’ve sorted them in the highest to lowest order. Below is the screenshot of the results provided for the reference -

Just click onto the heading of a measure and sort them.

I’m also attaching the working of the PBIX file for the reference purposes.

Hoping you find this useful and meets your requirements.

Note: If this doesn’t solves your problem then please upload a file for the further assistance.

Thanks and Warm Regards,
Harsh

Sort - Harsh.pbix (657.2 KB)

2 Likes

Hi Harsh,

This works for your data as it is all positive figures. If you multiply your ‘Total Sales’ by .6 you will see the issue.
image

How would you fix that?

Hi there
Without seeing your power bi file, as @Harsh explained in his reply. It could be your data not having the right sign or your formula needs to be multiply by -1. Your calculation could be wrong.

To me it sounds like its the way the data is coming in…for example if your sales are coming in as negatives (credits) from your system then your formula needs to be switched by multiply by -1 then you will have to check your branching formulas to make sure your doing the right calculation.

thanks
Keith

Hi,

I have just reused Harsh’s pbix file here as it is the same issue. The measures used here are the same as mine. The ‘order’ that it is using is the very first number in the result e.g. 10 and 100 could come after each other. The example above shows -8.85, -7.88 and then 6.67 followed soon by a minus number.

FORMAT example.pbix (658.1 KB)

Hello @Nurry90,

As suggested earlier, when a “FORMAT()” function is used it converts the numericals into the text format and that’s what it’s actually happening here in this case as well.

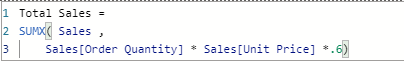
And therefore, we’ll have to rely on an alternative approach or a trick. So the trick here is, to create another measure just for sorting purposes. Below is the measure provided for the reference purposes -

Sorting Measure = 
VAR _Total_Sales_Sort = 
IF( ISBLANK( [Total Sales 1] ) ,
    BLANK() ,
    RANKX( ALL( Products ) , [Total Sales 1] , , DESC ) )

VAR _Total_Costs_Sort =
IF( ISBLANK( [Total Sales 1] ) , 
    BLANK() ,
    RANKX( ALL( Products ) , [Total Costs] , , DESC ) )

VAR _Total_Profits_Sort = 
IF( ISBLANK( [Total Sales 1] ) , 
    BLANK() , 
    RANKX( ALL( Products ) , [Total Profits 1] , , DESC ) )

VAR _Percentage_Profit_Margin_Sort = 
IF( ISBLANK( [Total Sales 1] ) , 
    BLANK() , 
    RANKX( ALL( Products ) , [% Profit Margin 1] , , DESC ) )

RETURN
SWITCH( TRUE() , 
    SELECTEDVALUE( 'Metric Selection'[Metric] ) = "Total Sales" , _Total_Sales_Sort , 
    SELECTEDVALUE( 'Metric Selection'[Metric] ) = "Total Costs" , _Total_Costs_Sort ,
    SELECTEDVALUE( 'Metric Selection'[Metric] ) = "Total Profits" , _Total_Profits_Sort ,
    SELECTEDVALUE( 'Metric Selection'[Metric] ) = "% Profit Margin" , _Percentage_Profit_Margin_Sort ,
_Total_Sales_Sort  )

Once this measure is created, put it in a table visual and sort it from highest to lowest order i.e., Rank 1 will be considered as highest and last rank will be considered as lowest. Below is the screenshot provided for the reference -

As you can see in the above screenshot, highest sales is ranked 1 and so on and so forth.

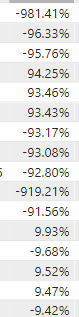
But as soon as you select, “% Profit Margin” metric, see what happens -

So now, as you can see, it’s sorting the “% Profit Margin” results from highest order to the lowest ones.

And finally, since this measure is just created for sorting purposes. Simply hide this column by dragging the header from right-to-left. Below is the screenshot of the final results provided for the reference -

I’m also attaching the working of the PBIX file for the reference purposes.

Hoping you find this useful and meets your requirements that you’ve been looking for. :slightly_smiling_face:

Note: Since you haven’t posted the working or your demo PBIX file, please make the changes accordingly as per your scenario requirements.

Thanks and Warm Regards,
Harsh

FORMAT example - Harsh.pbix (660.3 KB)

4 Likes

Thank you so much for that detailed answer @Harsh

We hope this helped you @Nurry90 :slight_smile:

If not, how far did you get and what kind of help you need further?

If yes, kindly mark as solution the answer that solved your query.

Hi @Nurry90, due to inactivity, a response on this post has been tagged as “Solution”. If you have any concern related to this topic, you can create a new thread.