Hello @Rodrigo_Palomino,
I was actually working onto that after I posted the first solution since I knew that this requirement will eventually come up.
And there’s actually a problem with the way tables are set-up and relationship’s created between the tables i.e. between “FinancialData” and “Chart of Accounts V2”. Since you’ve created a relationship between these two tables changing of signs is not possible because even though if you specify the condition as -
SELECTEDVALUE( 'Chart of Account V2'[STDC 0] = "Revenue" )
Or
SELECTEDVALUE( 'Chart of Account V2'[STDC 0] ) = "Expenses" )
It’ll still straight away ignore this type of conditions and will not allow you to change the signs because what’s actually happening here is although the measure was written like this for Actuals and same for Budgets -
Total Actual - Harsh =
VAR _Revenue =
CALCULATE(
    CALCULATE ( [Total Amount Base] ,
        Scenario[Scenario] = "AC" ) ,
    'Chart of Account V2'[STDC 0] = "Revenue" )

VAR _Expenses =
CALCULATE(
    CALCULATE ( [Total Amount Base] ,
        Scenario[Scenario] = "AC" ) ,
    'Chart of Account V2'[STDC 0] = "Expenses" ) * -1

VAR _Results =
SWITCH( TRUE() ,
    SELECTEDVALUE( 'Chart of Account V2'[STDC 0] ) = "Revenue" , _Revenue ,
    SELECTEDVALUE( 'Chart of Account V2'[STDC 0] ) = "Expenses" , _Expenses ,
_Revenue + _Expenses )

RETURN
_Results
But at the back end, it’s evaluating the measure like this -
Total Actual - Harsh =
VAR _Revenue =
CALCULATE(
    CALCULATE ( [Total Amount Base] ,
        Scenario[Scenario] = "AC" ) ,
    'Chart of Account V2'[STDC 0] = "Revenue" )

VAR _Expenses =
CALCULATE(
    CALCULATE ( [Total Amount Base] ,
        Scenario[Scenario] = "AC" ) ,
    'Chart of Account V2'[STDC 0] = "Expenses" ) * -1

VAR _Results =
_Revenue + _Expenses )

RETURN
_Results
And no matter what condition you specify in your formula or measure it’ll ignore everything just because a relationship has been created.
On the forum, in my previous solutions as well, I’ve already suggested - “Never ever create a relationship with the Template Tables” because once you do that and create a relationship that’s where things will start to go downhill. In your case as well, exact that same thing is happening and a active relationship is not allowing you change the signs.
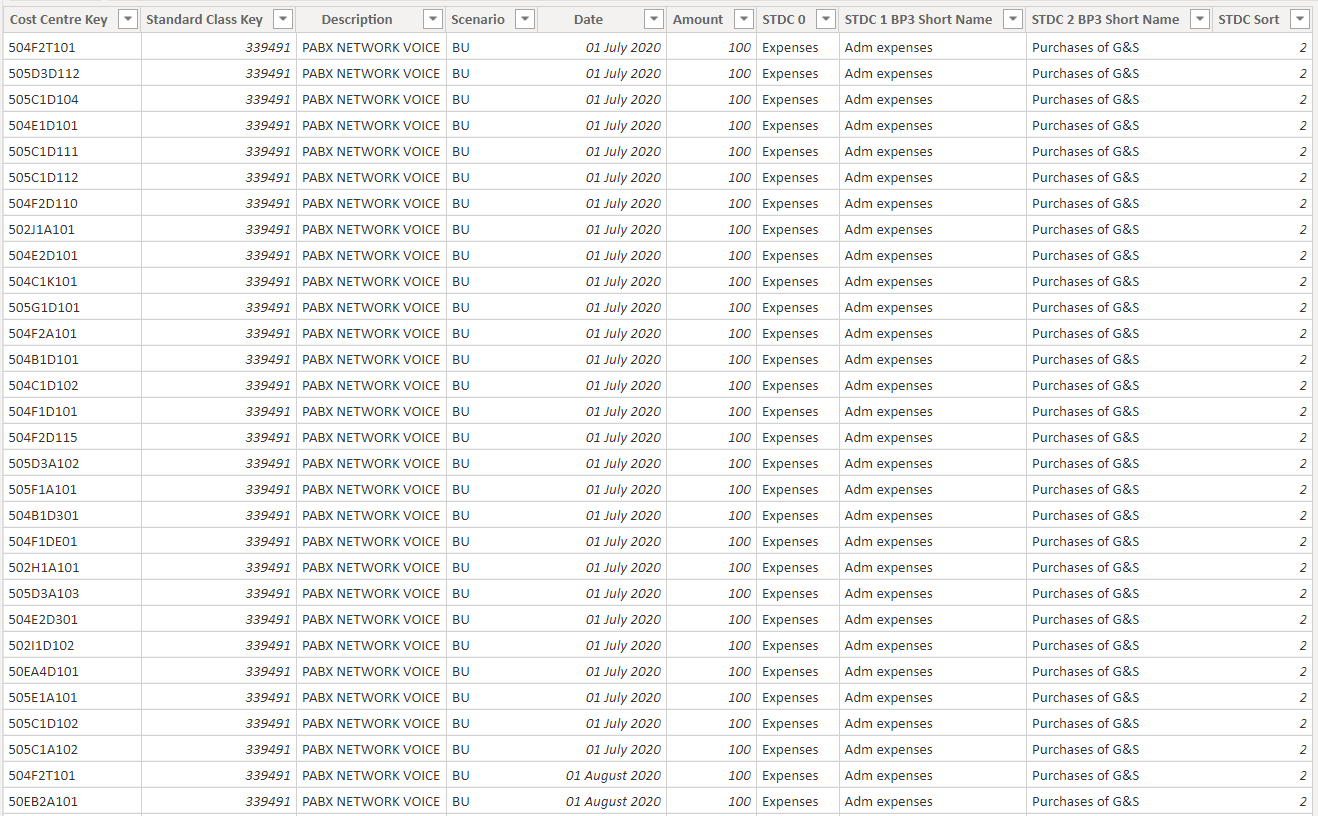
So to achieve the solution I created a new file with the revised data model. Based on the column “Standard Class Key” which is common between the FinancialData table and Chart of Acoounts V2 table, I merged them and imported the columns - “STDC 0”, “STDC 1 BP3 Short Name” and “STDC 1 BP3 Short Name” into the FinancialData table. So this is how your revised FinancialData table looks like -
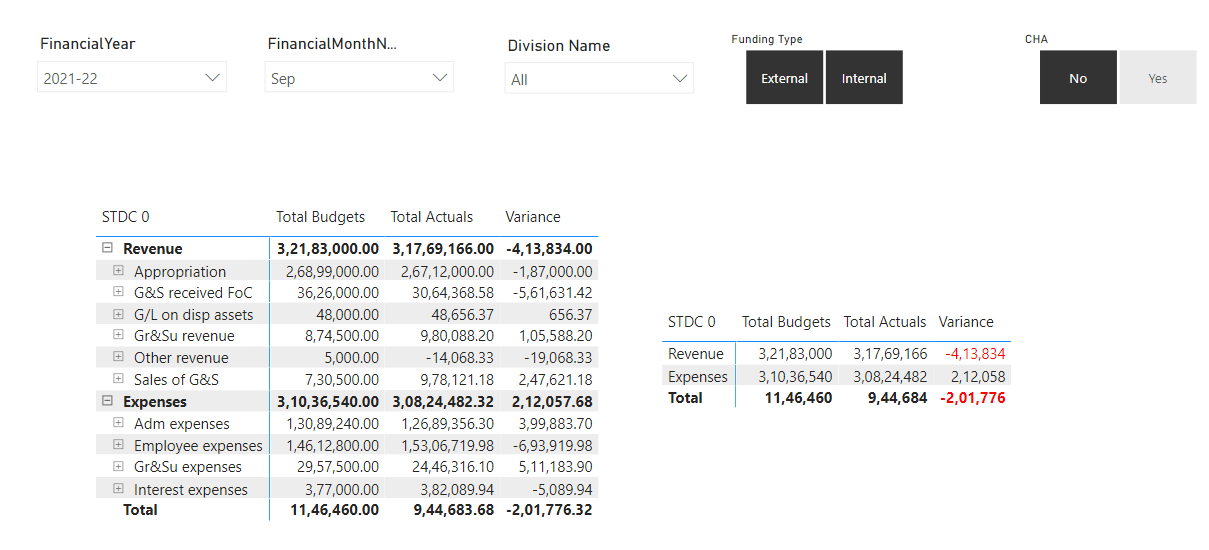
And then I created below provided measures to achieve the results -
Total Actuals =
VAR _Revenue =
CALCULATE( SUM( 'Financial Data'[Amount] ) ,
    'Financial Data'[Scenario] = "AC" ,
    'Financial Data'[STDC 0] = "Revenue" ,
    DATESYTD( Dates[Date] , "30/6" ) )

VAR _Expenses =
CALCULATE( SUM( 'Financial Data'[Amount] ) ,
    'Financial Data'[Scenario] = "AC" ,
    'Financial Data'[STDC 0] = "Expenses" ,
    DATESYTD( Dates[Date] , "30/6" ) )

VAR _Results =
SWITCH( TRUE() ,
    SELECTEDVALUE( 'Financial Data'[STDC 0] ) = "Revenue" , _Revenue ,
    SELECTEDVALUE( 'Financial Data'[STDC 0] ) = "Expenses" , _Expenses ,
    _Revenue - _Expenses )

RETURN
_Results


Total Budgets =
VAR _Revenue =
CALCULATE( SUM( 'Financial Data'[Amount] ) ,
    'Financial Data'[Scenario] = "BU" ,
    'Financial Data'[STDC 0] = "Revenue" ,
    DATESYTD( Dates[Date] , "30/6" ) )

VAR _Expenses =
CALCULATE( SUM( 'Financial Data'[Amount] ) ,
    'Financial Data'[Scenario] = "BU" ,
    'Financial Data'[STDC 0] = "Expenses" ,
    DATESYTD( Dates[Date] , "30/6" ) )

VAR _Results =
SWITCH( TRUE() ,
    SELECTEDVALUE( 'Financial Data'[STDC 0] ) = "Revenue" , _Revenue ,
    SELECTEDVALUE( 'Financial Data'[STDC 0] ) = "Expenses" , _Expenses ,
    _Revenue - _Expenses )

RETURN
_Results


Variance =
SWITCH( TRUE() ,
    SELECTEDVALUE( 'Financial Data'[STDC 0] ) = "Revenue" , [Total Actuals] - [Total Budgets] ,
    SELECTEDVALUE( 'Financial Data'[STDC 0] ) = "Expenses" , [Total Budgets] - [Total Actuals] ,
    [Total Actuals] - [Total Budgets] )
I’m also attaching the working of the Excel as well as PBIX file for the reference as well as providing a link of the post where I’ve stated why not to create relationship with the “Template tables”.
Hoping you find this useful and meets your requirements that you’ve been looking for. ![]()
Important Note:
1). To view the transformations, please go through the Power Query where you can check out the “Applied Steps” section.
2). Once you revise your data model you’ll be required to change your measures accordingly, wherever neccesary since it was observed that you’ve used “Measure Branching Technique” at a great scale in your analysis.
Thanks and Warm Regards,
Harsh
Profit and Loss - Harsh Data.xlsx (3.9 MB)
Profit and Loss - Variance Calculation - Harsh.pbix (776.1 KB)