Modify Calc within Selected Value logic

The first step in this problem was already kindly solved by ‘Harsh’. Now I need to add a row from the source table to the first step calculation result (Step #2). All relevant work-in-progress files have been attached. Thanks in advance!
split category into sub-category _ v2.pbix (46.3 KB)
Split category into sub-category _ v2.xlsx (12.6 KB)

Hello @mdalton2100,

Thank You for posting your query onto the Forum.

Below is the measure alongwith the screenshot of the final results provided for the reference purposes -

Conditional Amount v2 = 
VAR _Category_X_and_Sub_Category_A_Calculation = 
DIVIDE(
    CALCULATE( SUM( 'Source Fact table'[Amt.] ) , 
        'Source Fact table'[Category (v1)] = "X" ) , 
    1.25 , 
    0 ) * 25 / 100

VAR _Category_X_and_Sub_Category_B_Calculation = 
DIVIDE(
    CALCULATE( SUM( 'Source Fact table'[Amt.] ) , 
        'Source Fact table'[Category (v1)] = "X" ) , 
    1.25 , 
    0 )

VAR _Category_Y_Calculation = 
CALCULATE( SUM( 'Source Fact table'[Amt.] ) , 
    'Source Fact table'[Category (v1)] = "Y" )

VAR _Category_Z_Calculation = 
CALCULATE( SUM( 'Source Fact table'[Amt.] ) , 
    'Source Fact table'[Category (v1)] = "Z" )

RETURN
SWITCH( TRUE() ,
    SELECTEDVALUE( 'Category and Sub-Category'[Category] ) = "X" && 
    SELECTEDVALUE( 'Category and Sub-Category'[Sub-Category] ) = "A" , 
    _Category_X_and_Sub_Category_A_Calculation + _Category_Z_Calculation ,
        

    SELECTEDVALUE( 'Category and Sub-Category'[Category] ) = "X" && 
    SELECTEDVALUE( 'Category and Sub-Category'[Sub-Category] ) = "B" , 
    _Category_X_and_Sub_Category_B_Calculation ,

    SELECTEDVALUE( 'Category and Sub-Category'[Category] ) = "Y" &&
    SELECTEDVALUE( 'Category and Sub-Category'[Sub-Category] ) = "Y" , 
    _Category_Y_Calculation ,

    SELECTEDVALUE( 'Category and Sub-Category'[Category] ) = "Z" &&
    SELECTEDVALUE( 'Category and Sub-Category'[Sub-Category] ) = "Z" , 
    0 ,

_Category_X_and_Sub_Category_A_Calculation + _Category_X_and_Sub_Category_B_Calculation + _Category_Y_Calculation + _Category_Z_Calculation )

I’m also attaching the working of the PBIX file for the reference purposes.

Hoping you find this useful and meets your requirements that you’ve been looking for. :slightly_smiling_face:

Thanks and Warm Regards,
Harsh

split category into sub-category _ v2 - Harsh.pbix (50.5 KB)

2 Likes

Hello Harsh,

Your solution does make sense, but I’m having trouble implementing it into my actual Data Model. It may be that my “Z” variable (‘Revaluation’) is calculated based on a different column than X (or Y). Here is a selected screenshot of the implemented DAX formula in my actual model. Unless you can spot the issue, I will try to enhance the generic .pbix file to simulate this issue (vis-a-vis your solution), as my homework assignment:

Rows that I want to sum together (purple boxes) … Right-column is my implementation of your solution. In other words, sum the $70K with ($3,953K):
image

Unfortunately, the DAX formula ignores the $70K — somehow the context or something else is overridding the simply sum operation:

Hello @mdalton2100,

It would be difficult to assist you on your actual formula/measure without looking at the PBIX file.

I suspect that “[Actuals (+/-)]” measure could be causing the problem but as said without looking at the file, it’ll be hard to provide the solution and will only invlove the guessing work.

Thanks and Warm Regards,
Harsh

Hi @mdalton2100 , did the response provided by @Harsh help you solve your query?

If not, kindly upload your PBIX as requested above so they can help you further with your inquiry.

If yes, kindly mark as solution the answer that solved your question.

Hi @mdalton2100, we’ve noticed that no response has been received from you October 21.

We just want to check if you still need further help with this post? In case there won’t be any activity on it in the next few days, we’ll be tagging this post as Solved.

Hello Harsh,

Sorry for the delay. I am posting my attempted implementation of your solution to my actual data model (redacted, of course). Getting close! The above screenshot of the problematic DAX formula still applies, and is called out in the .pbix file. If you need the other look-up tables, let me know and I will post them. Thanks.

Product _ Gross Margin.pbix (1.2 MB)
Fact Table.xlsx (5.6 MB)

Yes, I still require help – see my latest post. I hope that will complete resolution of this topic. Thank you.

Hello @mdalton2100,

Thank You for providing the reference PBIX files.

The reason why you were not able to achieve the results is because of the way you had designed your data model and created the relationship between the tables. i.e. between “Gross Margin Transactions” table and “Mapping For Flux Analysis Only” table.

Since your “Gross Margin Transactions” table is a Fact Table and “Mapping For Flux Analysis Only” table is being used as a Template Table. Why do you want to create a relationship between them?

And that too, the relationship which you had created was “Many-to-Many” with “Bi-directional Filters”. Below is the screenshot of your data model provided for the reference -

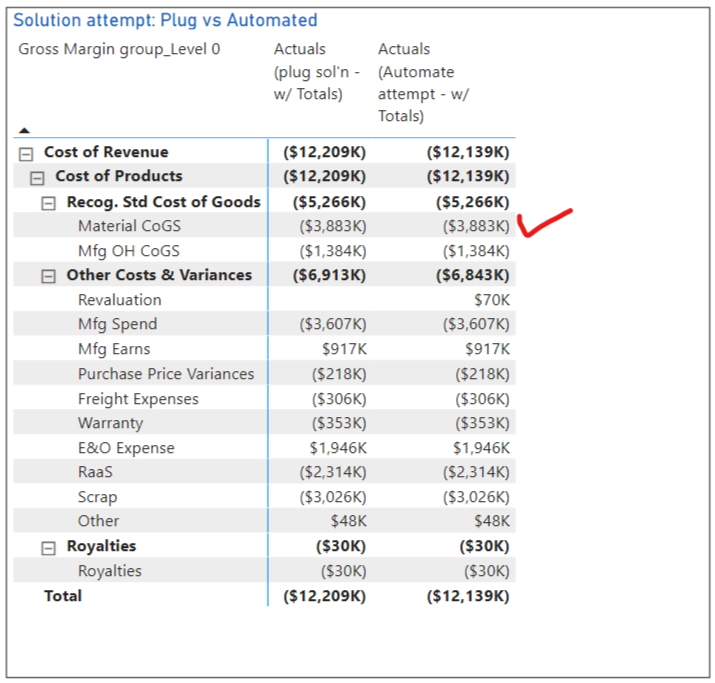
Due to this, it was not able to evaluate the correct results i.e. $70K was not getting reflected inside the “Material CoGS” criteria. Below is the screenshot provided for the reference -

Now, once you delete the “Many-to-Many Relationship” between these two tables you’ll see that it’ll start to evaluate the results correctly. Below are the screenshots of the revised data model and the final results provided for the reference -

I’m also attaching the working of the PBIX file as well as providing few of the links below pertaining to the “Many-to-Many Relationships” for the reference purposes.

Hoping you find this useful and meets your requirements that you’ve been looking for. :slightly_smiling_face:

Important Note:

Make this a thumb rule that never ever create a relationship between your Fact Table or Dimension Table with that of the Template Tables.

Fact Tables contains the information pertaining to the analytical aspects or transactional information whereas Dimension Tables are used for slicing and dicing the data.

But Template Tables have absolutely nothing to do with any of these tables they’re just the mere secondary or supporting tables in your data model which are just being used to show the information in a specified format and nothing else.

Lastly, unless and until you know the exact behaviour of the “Many-to-Many Relationships” never use it never in your data model. It’s best to create a relationship virtually within your measure using the TREATAS() function.

Thanks and Warm Regards,
Harsh

Product _ Gross Margin.pbix (1.2 MB)

2 Likes

Hello Harsh,

Yes, your solution is very useful and it does meet my requirements.

I had a suspicion the solution was right under my nose. When I initially applied your solution, I mistakenly believed that – in order to leverage the Dimension tables with measure(s) built using the Template table – it was necessary to create a relationship with the Fact table. How wrong I was. It’s not clear to me, however, how it’s possible to leverage the Dimension tables without any formal table relatonship being defined between the Template table and the other (Fact?) tables. I suppose it’s because the measures have Calculate formulas that explicitly reference the Fact table.

Yes, I will need to become better educated on many-to-many relationship concepts … and apply with care. I do appreciate all the resources that you provided. Thank you!

Regards,
Marcus

Hello @mdalton2100,

You’re Welcome. :slightly_smiling_face:

I’m glad that I was able to assist you and you find the resources helpful.

Thanks and Warm Regards,
Harsh