Is there a visualization that can present the data in Swimmer Plot visual (sample visual attached)?
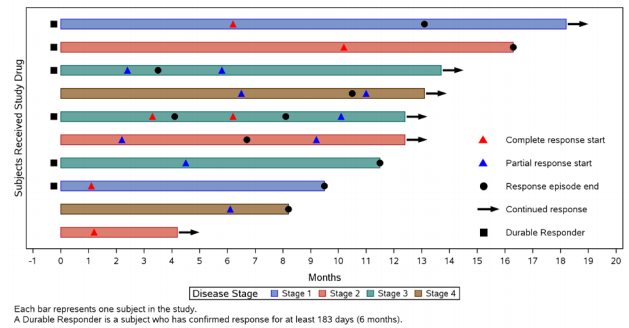
Is there a visualization that can present the data in Swimmer Plot visual (sample visual attached)?
If you’re willing to go the R route, you can do this via the “Swimplot” package in conjunction w/ ggplot2 (the foundational package for R visualizations), calling the script from within Power BI. Check out the link below - R offers a dizzying array of formatting options for Swimmer Plots:
https://cran.r-project.org/web/packages/swimplot/vignettes/Introduction.to.swimplot.html
I hope this is helpful.
– Brian
Hi @brjeeth, did the response provided by @BrianJ help you solve your query? If not, how far did you get and what kind of help you need further? If yes, kindly mark as solution the answer that solved your query. Thanks!
Hi @brjeeth, we’ve noticed that no response has been received from you since the 24th of April. We just want to check if you still need further help with this post? In case there won’t be any activity on it in the next few days, we’ll be tagging this post as Solved.
I couldn’t log into the Forum for the past few days…I have now marked @BrianJ response as a solution. Thanks!!
